Fig. 4
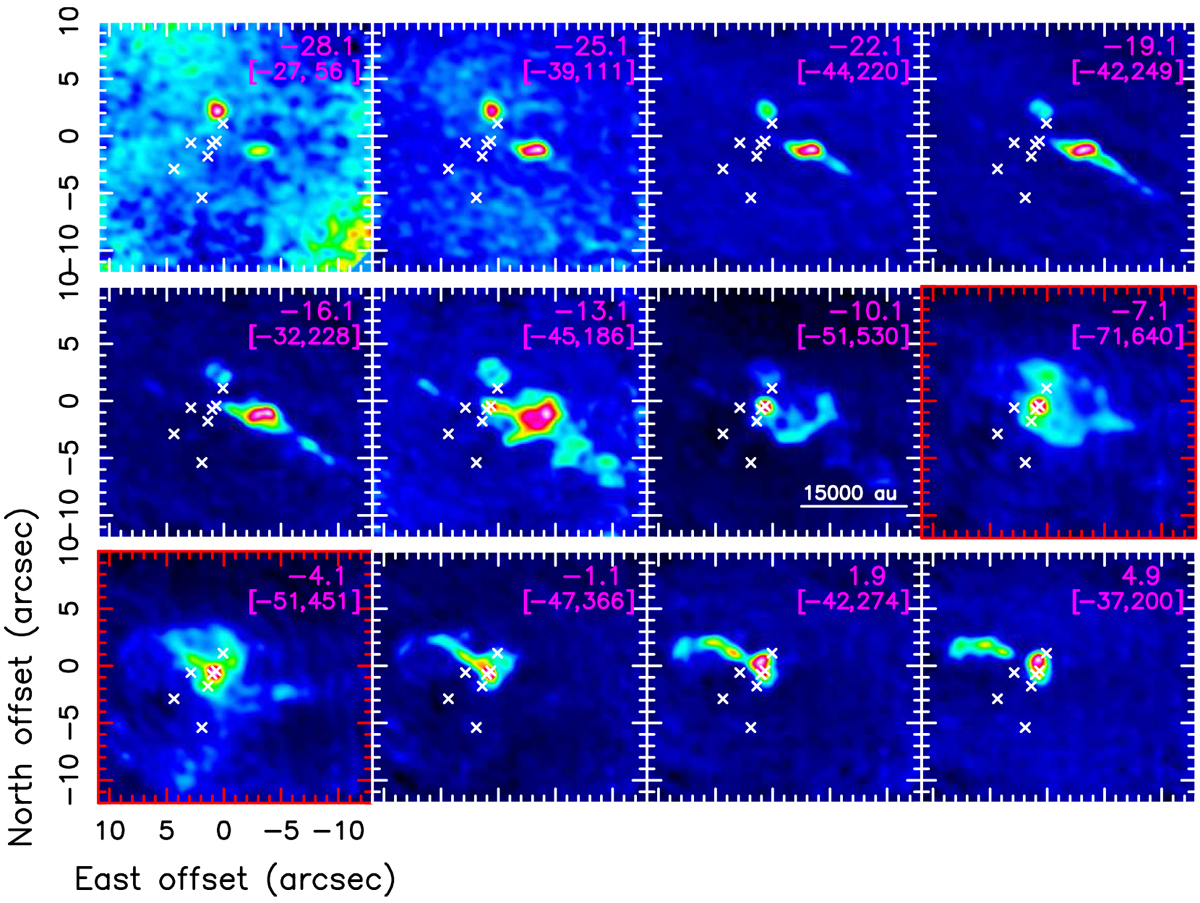
Merged NOEMA–IRAM 30 m data. Each panel presents the emission of the SO JN = 65–54 line (color map) in a different velocity channel. In the upper right corner of the panel, the channel VLSR (in kilometer per second) and the range of plotted intensity (in square parentheses in milliJansky per beam) are reported. The red boxes and ticks identify the panels corresponding to the central velocities, that is |VLSR − Vsys| < 3 km s−1. The white crosses mark the positions of the seven strongest peaks of the 1.37 mm continuum emission.
Current usage metrics show cumulative count of Article Views (full-text article views including HTML views, PDF and ePub downloads, according to the available data) and Abstracts Views on Vision4Press platform.
Data correspond to usage on the plateform after 2015. The current usage metrics is available 48-96 hours after online publication and is updated daily on week days.
Initial download of the metrics may take a while.