Fig. 2
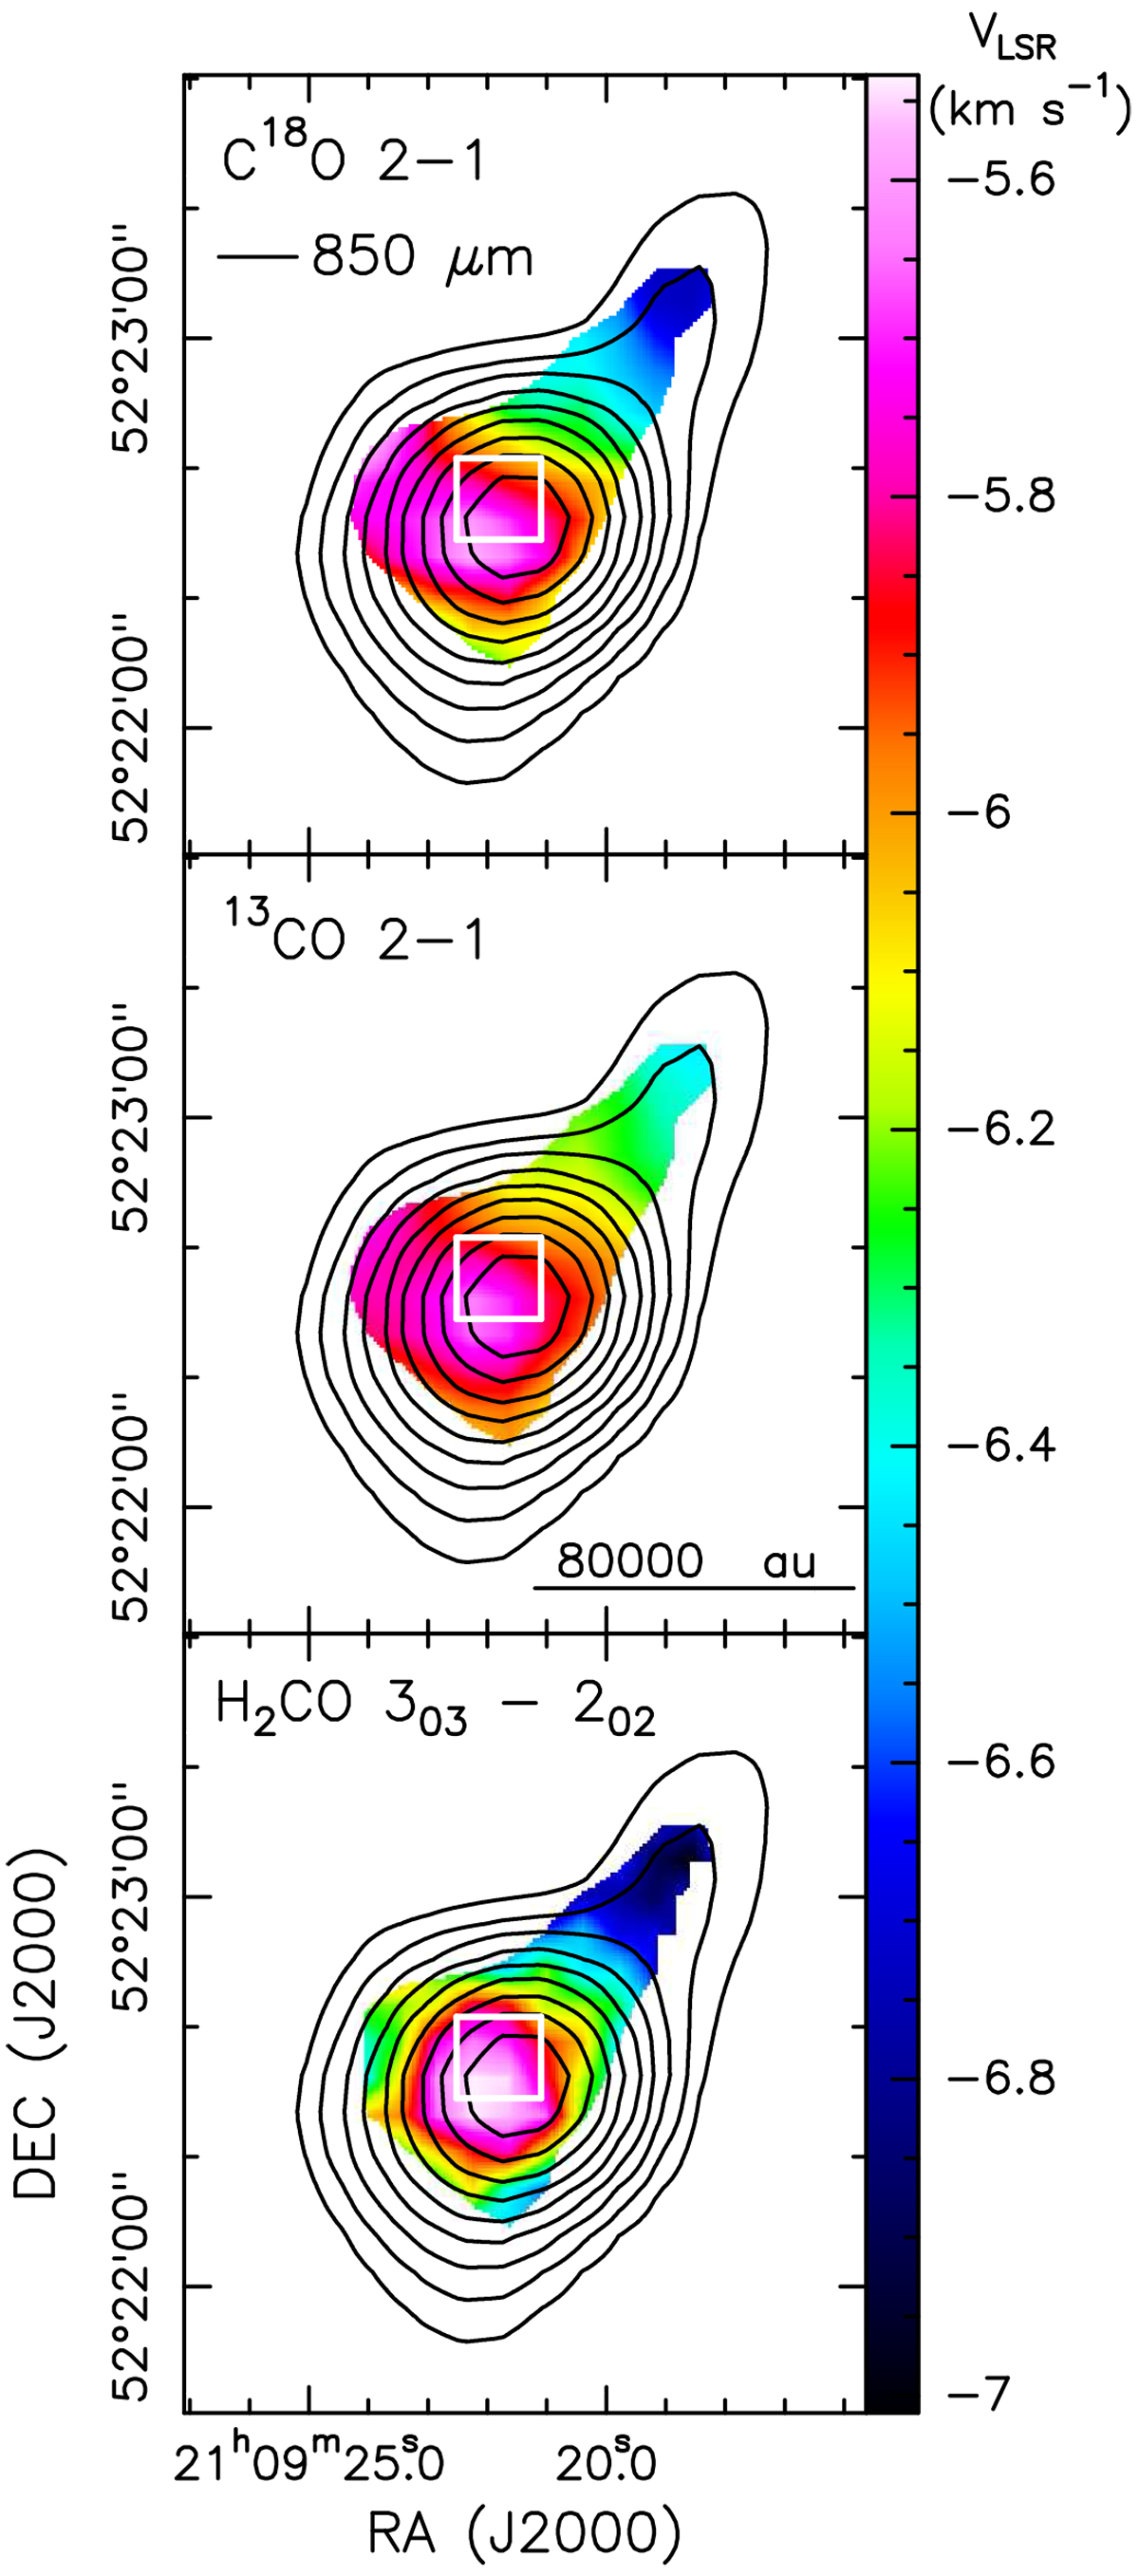
IRAM 30 m data. Intensity-weighted velocity (color map) of the C18O J = 2–1 (upper panel), 13CO J = 2–1 (middle panel), and H2CO ![]() 30,3–20,2
(lower panel) lines determined over a small velocity range, [−7.3, −3.5] km s−1, around Vsys = −6.1 km s−1. The plotted region corresponds to the area in which the velocity-integrated emission of the C18O J = 2–1 line is higherthan 44 Jy beam−1 km s−1,
≈10σ. In each panel, the black contours represent the SCUBA 850 μm continuum (Di Francesco et al. 2008), showing 10 levels increasing logarithmically from 1 to 11.4 Jy beam−1. The white rectangle delimits the region plotted in the upper panel of Fig. 1.
30,3–20,2
(lower panel) lines determined over a small velocity range, [−7.3, −3.5] km s−1, around Vsys = −6.1 km s−1. The plotted region corresponds to the area in which the velocity-integrated emission of the C18O J = 2–1 line is higherthan 44 Jy beam−1 km s−1,
≈10σ. In each panel, the black contours represent the SCUBA 850 μm continuum (Di Francesco et al. 2008), showing 10 levels increasing logarithmically from 1 to 11.4 Jy beam−1. The white rectangle delimits the region plotted in the upper panel of Fig. 1.
Current usage metrics show cumulative count of Article Views (full-text article views including HTML views, PDF and ePub downloads, according to the available data) and Abstracts Views on Vision4Press platform.
Data correspond to usage on the plateform after 2015. The current usage metrics is available 48-96 hours after online publication and is updated daily on week days.
Initial download of the metrics may take a while.