Fig. A.1
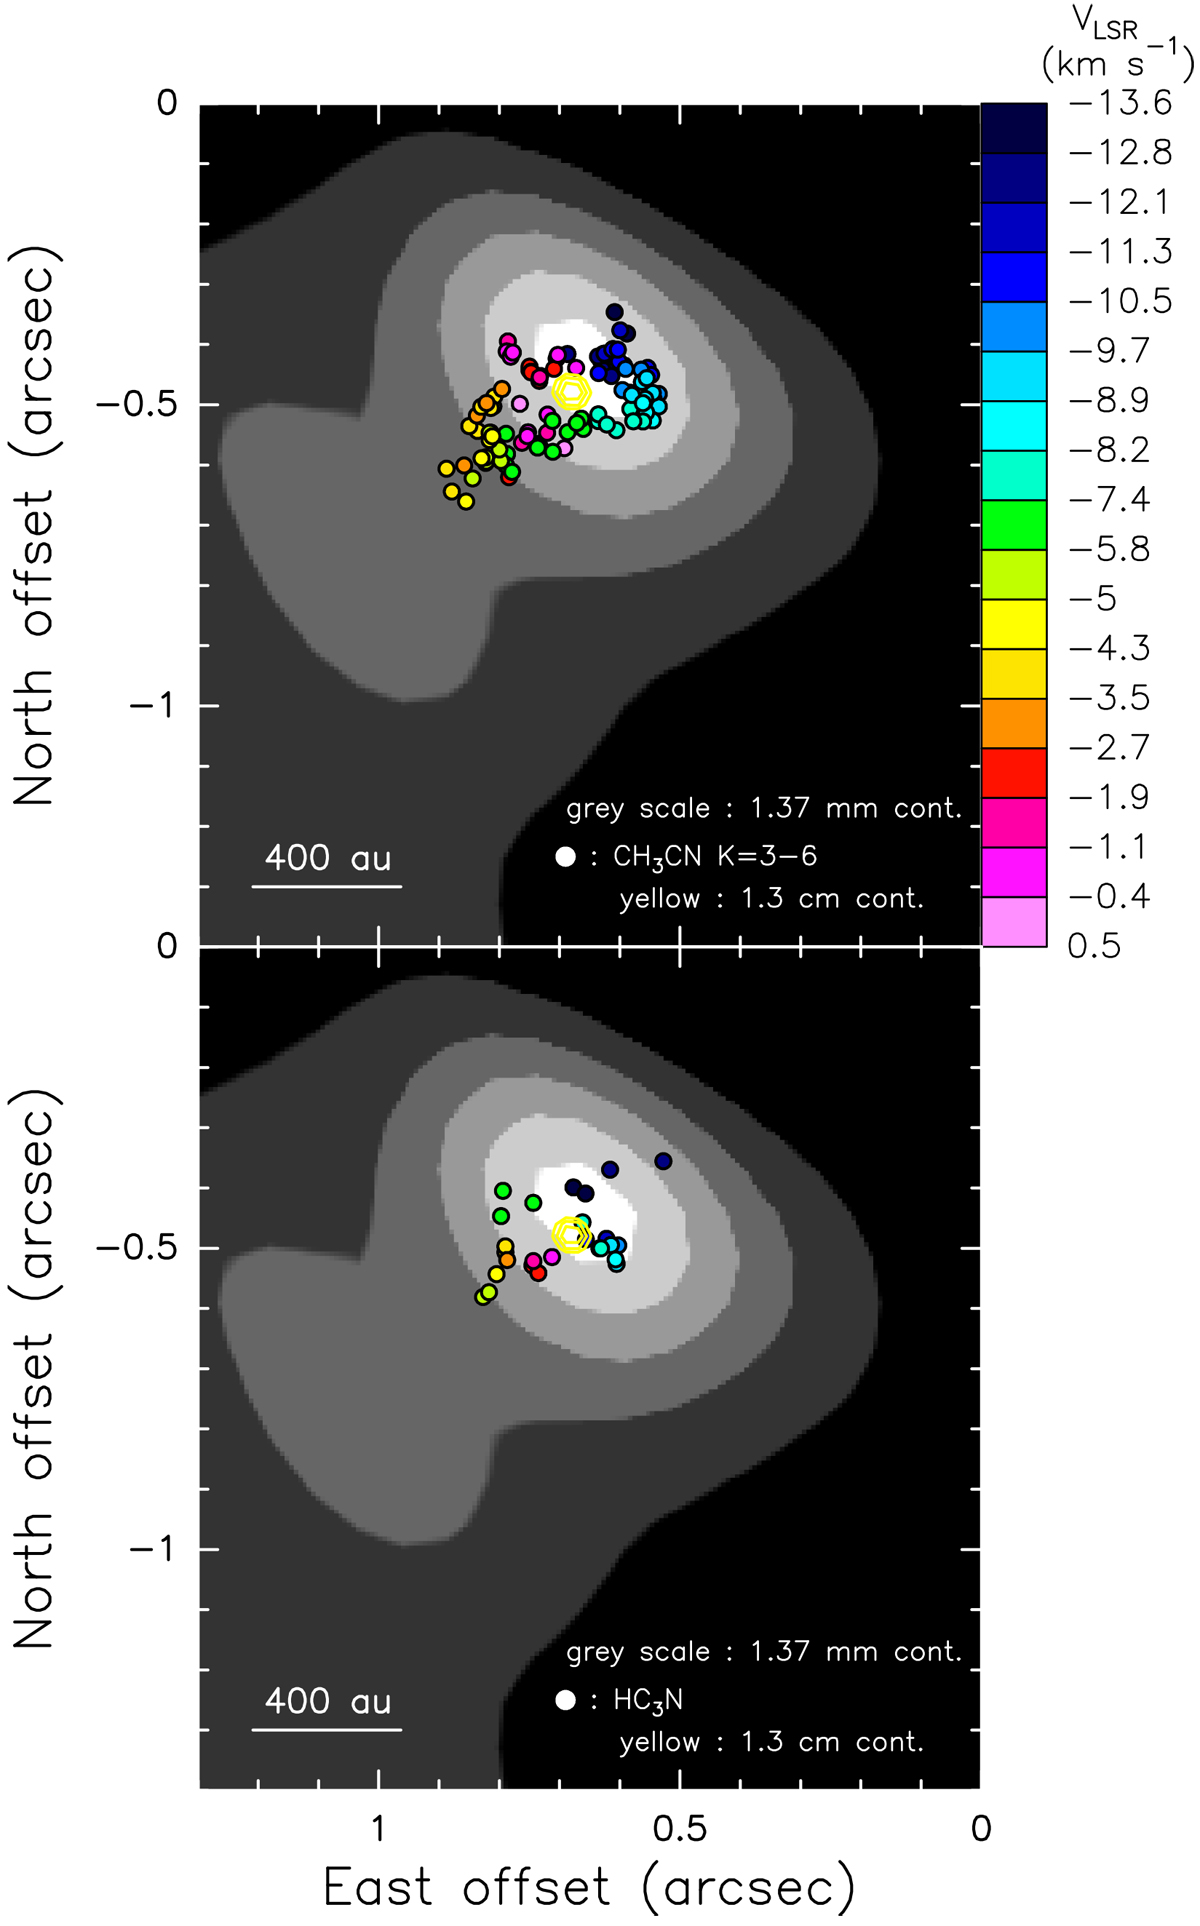
NOEMA data. The gray-scale map reproduces the 1.37 mm continuum emission, plotting values in the range 10–35 mJy beam−1. The colored dots give the (Gaussian-fitted) positions of the channel emission peaks for the CH3 CN JK = 12K–11K (K = 3–6) (upper panel) and HC3N J = 24–23 (lower panel) lines; the color denotes the channel VLSR. The yellow contours show the JVLA A-Array continuum at 1.3 cm (Moscadelli et al. 2016), showing levels at 70, 80, and 90% of the peak emission of 0.50 mJy beam−1.
Current usage metrics show cumulative count of Article Views (full-text article views including HTML views, PDF and ePub downloads, according to the available data) and Abstracts Views on Vision4Press platform.
Data correspond to usage on the plateform after 2015. The current usage metrics is available 48-96 hours after online publication and is updated daily on week days.
Initial download of the metrics may take a while.