Fig. 15
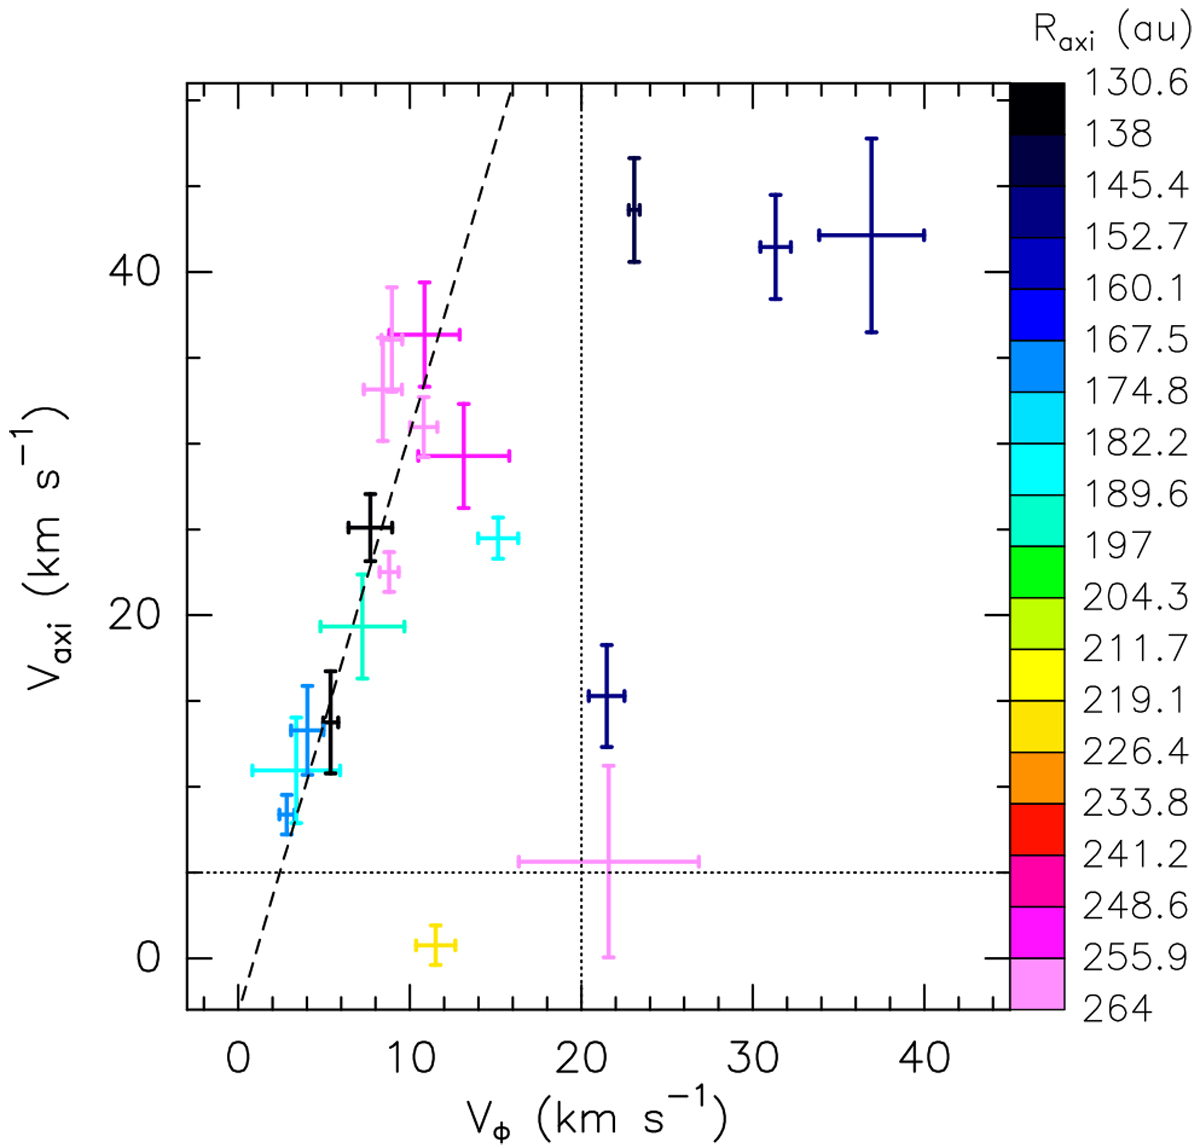
Components Vaxi vs. VΦ (see definitions in Sect. 4.3) for the 3D maser velocities shown in Fig. 12. Colored error bars are used to indicate values and associated errors; the colors represent the distance from YSO-1 projected along the jet axis, Raxi, as coded in the wedge on the right-hand side of the panel. The black dashed line shows the linear fit to the subset of points within the region delimited by the horizontal and vertical black dotted lines, corresponding to VΦ ≤ 20 km s−1 and Vaxi ≥ 5 km s−1.
Current usage metrics show cumulative count of Article Views (full-text article views including HTML views, PDF and ePub downloads, according to the available data) and Abstracts Views on Vision4Press platform.
Data correspond to usage on the plateform after 2015. The current usage metrics is available 48-96 hours after online publication and is updated daily on week days.
Initial download of the metrics may take a while.