Fig. 12
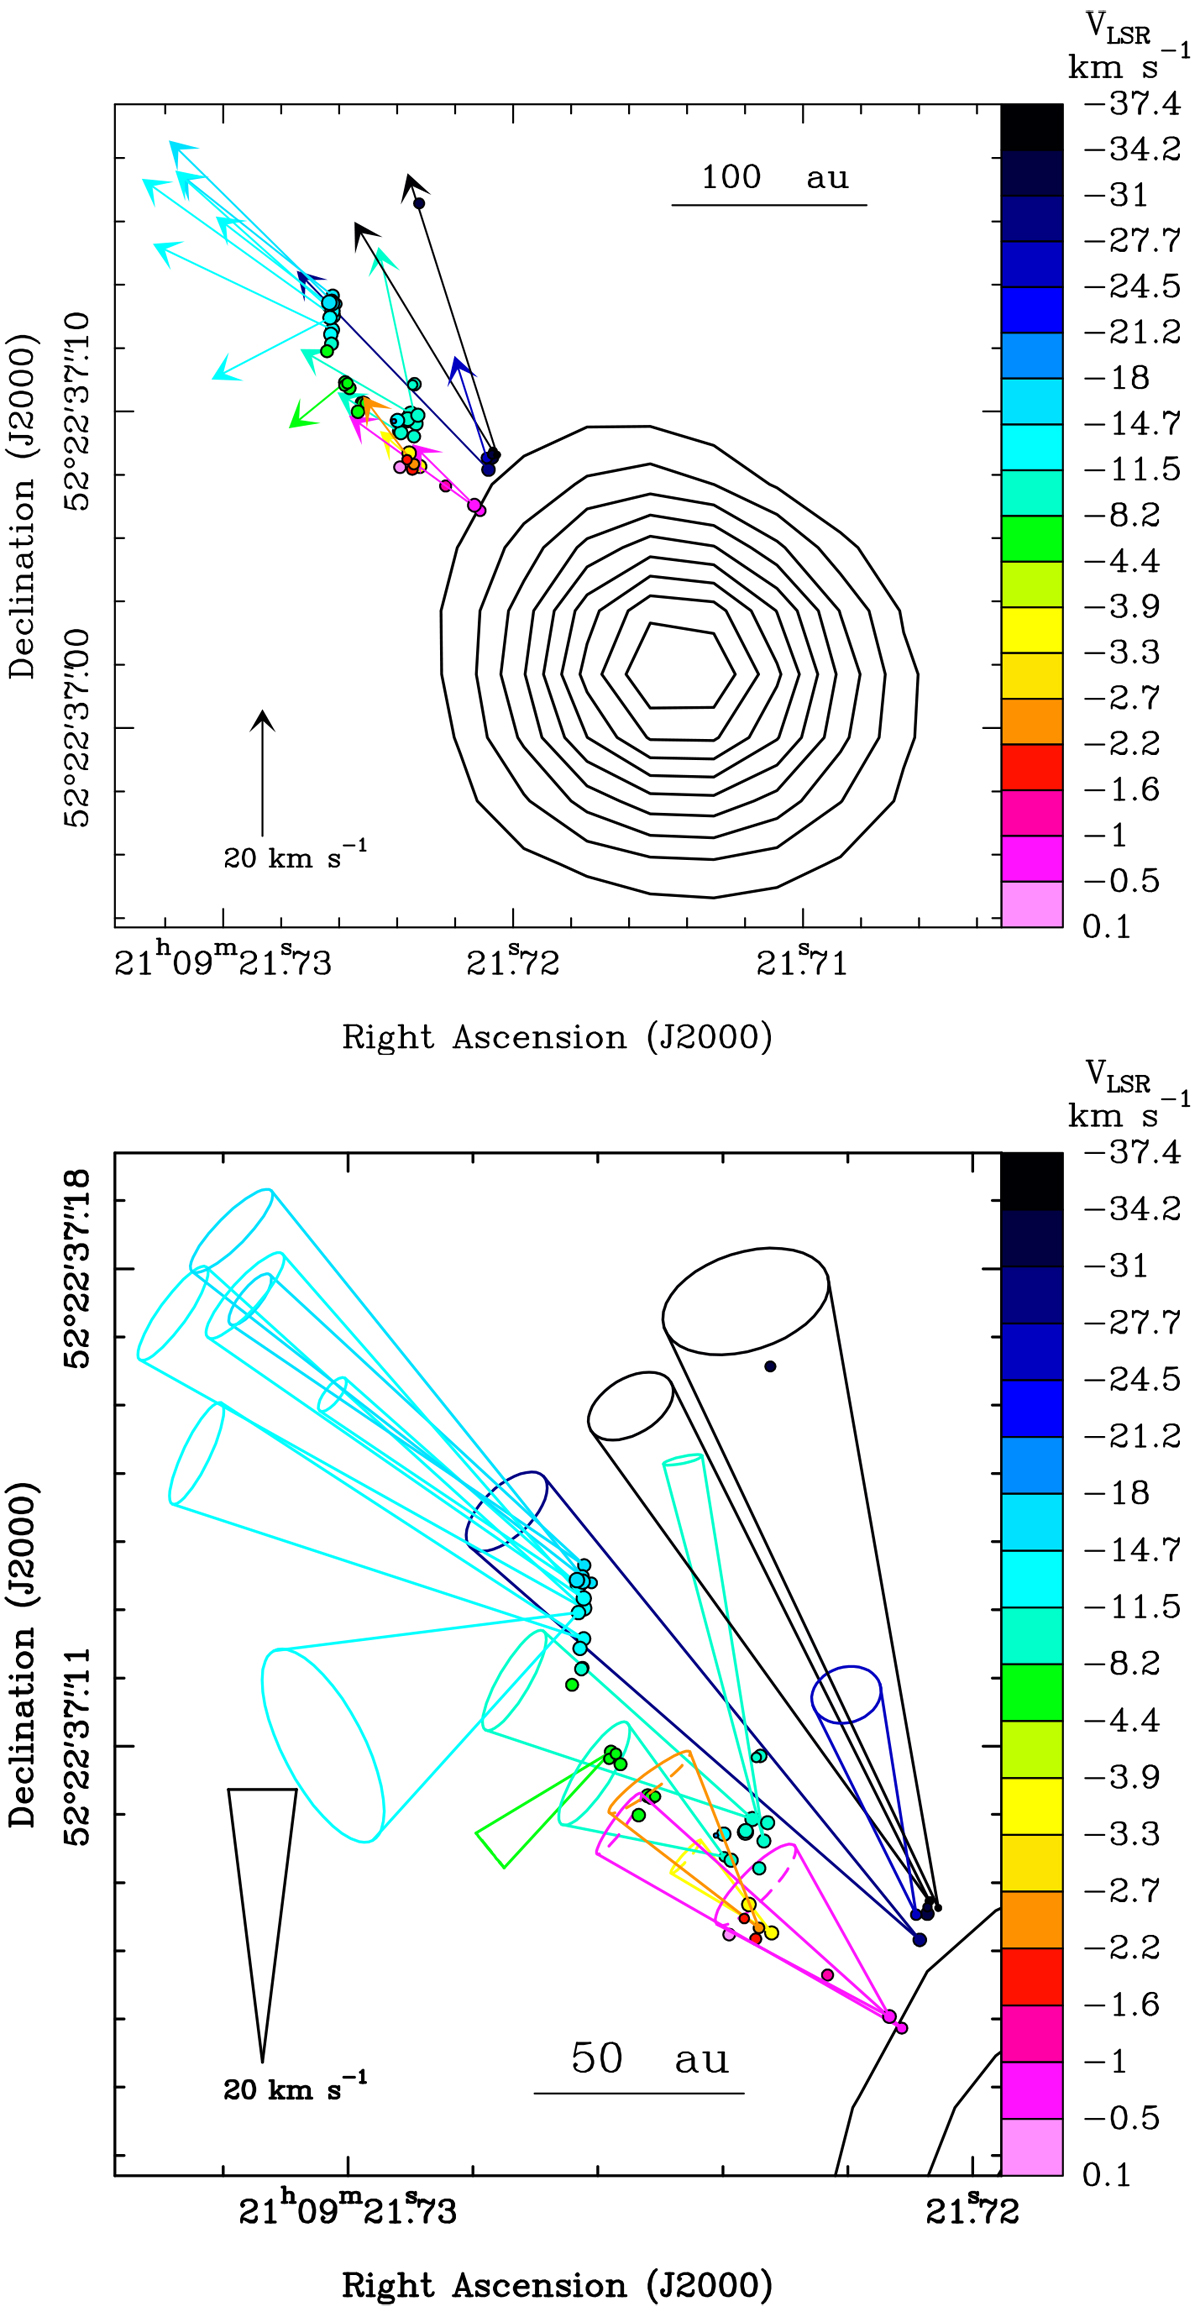
POETS water maser observations. Upper panel: colored dots and arrows give absolute positions and proper motions of the 22 GHz water masers determined with VLBI observations (Moscadelli et al. 2016); colors denote the maser VLSR. The dot area scales logarithmically with the maser intensity. The black contours indicate the JVLA A-Array continuum at 1.3 cm (Moscadelli et al. 2016), showing levels from 10 to 90% of the peak emission of 0.50 mJy beam−1 in steps of 10%. Lower panel: colored dots and black contours have the same meaning as in the upper panel. Colored cones are employed to visualize the maser 3D velocities, representing the inclination with respect to the LOS through the ellipticity of the cone basis and the uncertainty in the direction by means of the cone aperture.
Current usage metrics show cumulative count of Article Views (full-text article views including HTML views, PDF and ePub downloads, according to the available data) and Abstracts Views on Vision4Press platform.
Data correspond to usage on the plateform after 2015. The current usage metrics is available 48-96 hours after online publication and is updated daily on week days.
Initial download of the metrics may take a while.