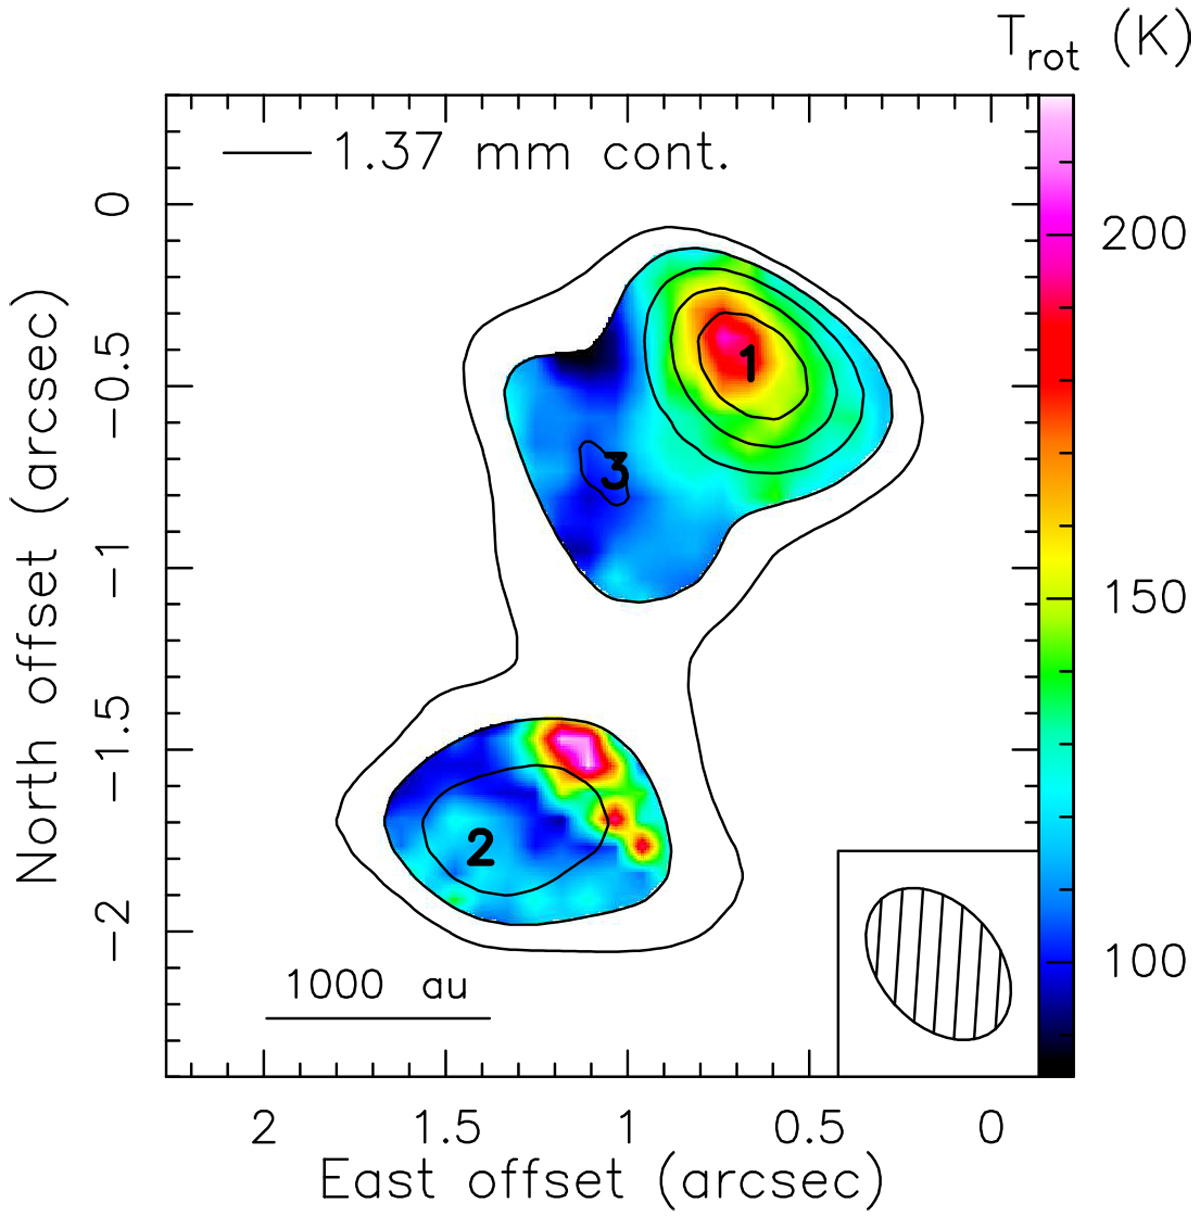
Fig. 11

NOEMA data. The color map shows the distribution of the rotational temperature derived by fitting with XCLASS the emission of the CH3CN JK = 12K–11K (K = 0–6) lines (including the CH3 13CN isotopologs). The plotted region corresponds to the area in which the 1.37 mm continuum emission is higher than 16 mJy beam−1. The black contours reproduce the 1.37 mm continuum, showing the same levels as in Fig. 7: the positions of the three strongest 1.37 mm peaks are indicated using the same labels as in Beuther et al. (2018, see Table 5). The restoring beam of the CH3 CN maps is shown in the lower right corner of the panel.
Current usage metrics show cumulative count of Article Views (full-text article views including HTML views, PDF and ePub downloads, according to the available data) and Abstracts Views on Vision4Press platform.
Data correspond to usage on the plateform after 2015. The current usage metrics is available 48-96 hours after online publication and is updated daily on week days.
Initial download of the metrics may take a while.


