Fig. 10
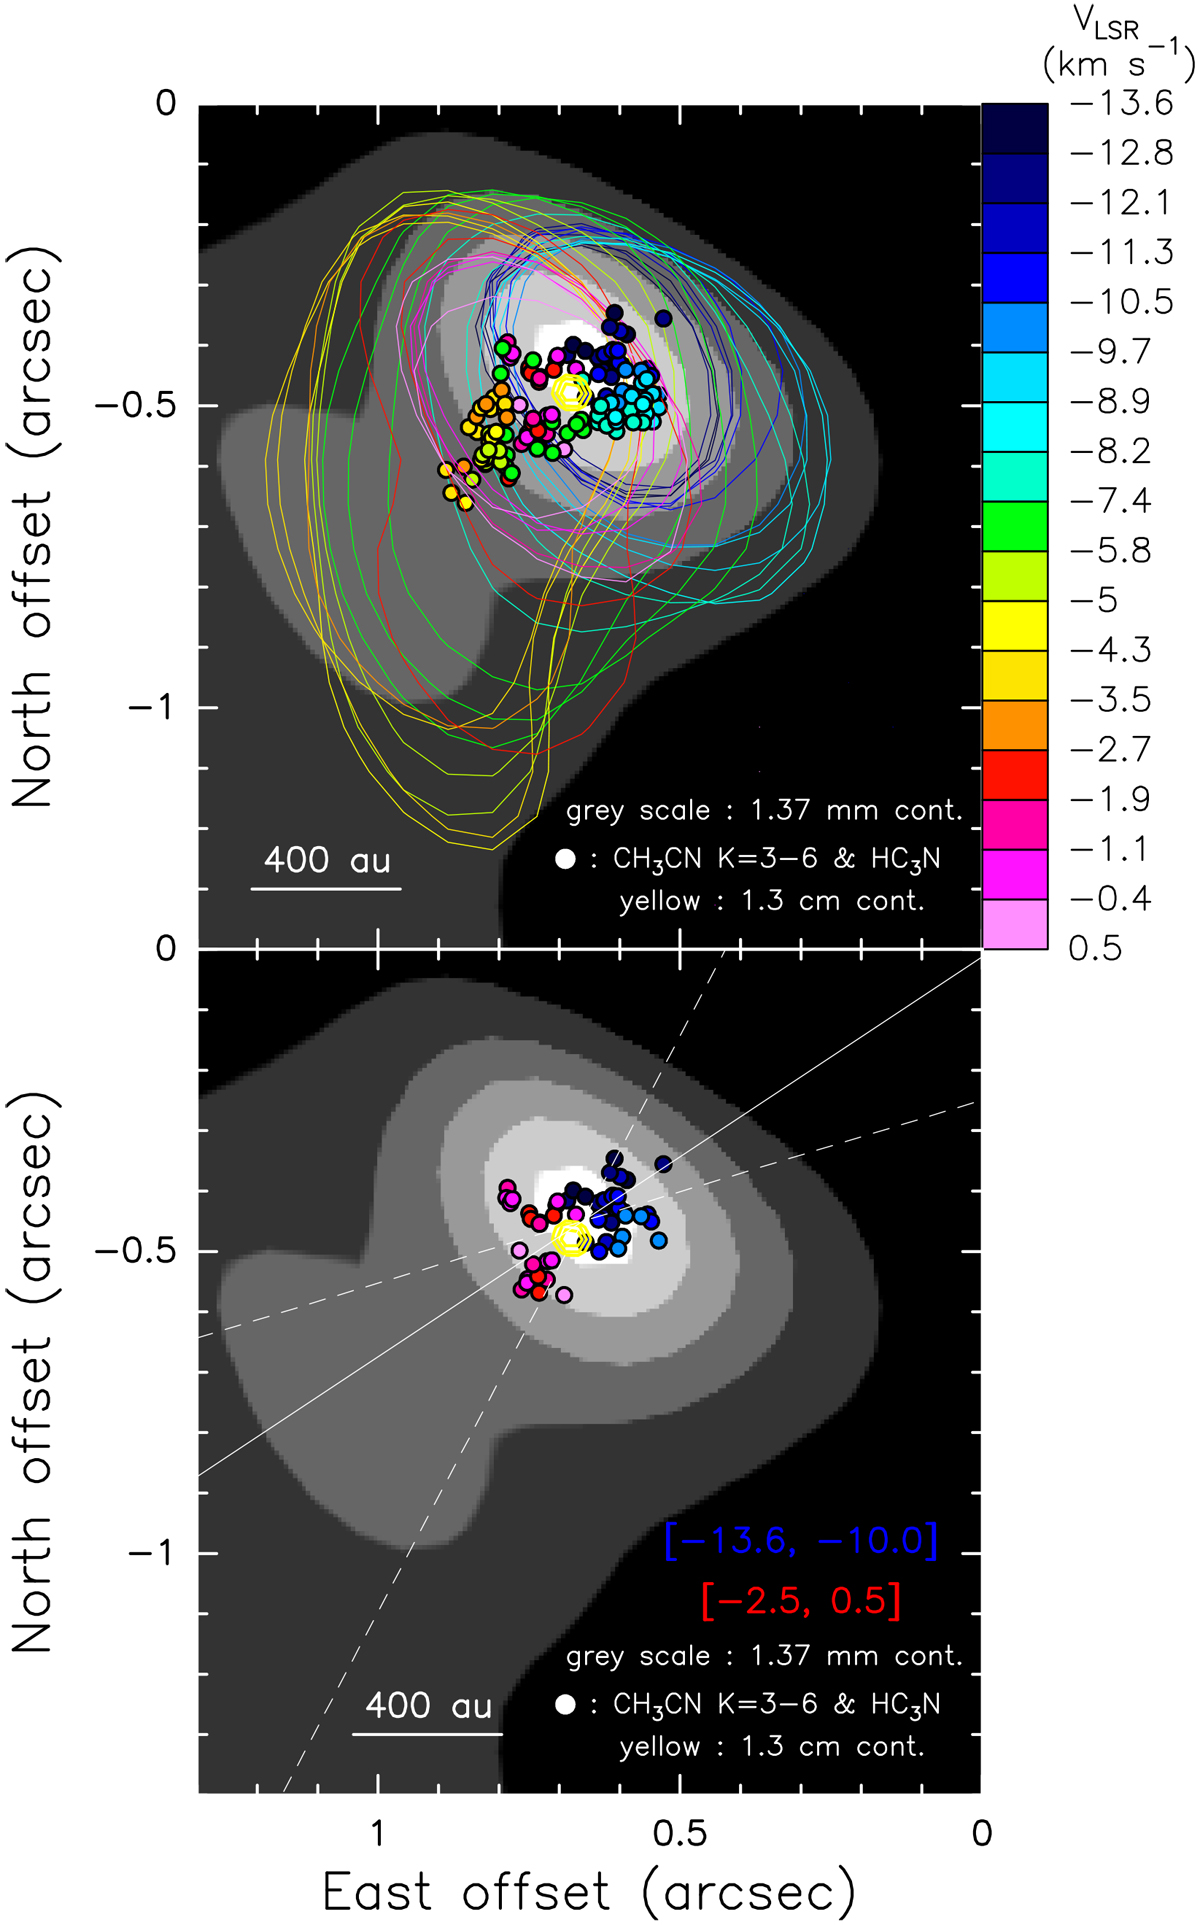
NOEMA data. Upper panel: the gray-scale map reproduces the 1.37 mm continuum emission, plotting values in the range 10–35 mJy beam−1. The colored dots give the (Gaussian-fitted) positions of the channel emission peaks for the CH3 CN JK = 12K–11K (K = 3–6) and HC3N J = 24–23 lines; the colors denote the channel VLSR. The colored contours indicate the half-peak level for the CH3CN JK = 123-113 emission in individual channels. The yellow contours show the JVLA A-Array continuum at 1.3 cm (Moscadelli et al. 2016), showing levels at 70, 80, and 90% of the peak emission of 0.50 mJy beam−1. Lower panel: the gray-scale map, yellow contours, and colored dots have the same meaning as in the upper panel. Only the channel emission peaks at the extreme blue- and red-shifted velocities (reported in the lower right corner of the panel) are shown. The white continuous and dashed lines indicate the best-fit major axis of the distribution of the peaks and the corresponding fit uncertainty, respectively.
Current usage metrics show cumulative count of Article Views (full-text article views including HTML views, PDF and ePub downloads, according to the available data) and Abstracts Views on Vision4Press platform.
Data correspond to usage on the plateform after 2015. The current usage metrics is available 48-96 hours after online publication and is updated daily on week days.
Initial download of the metrics may take a while.