Fig. 1
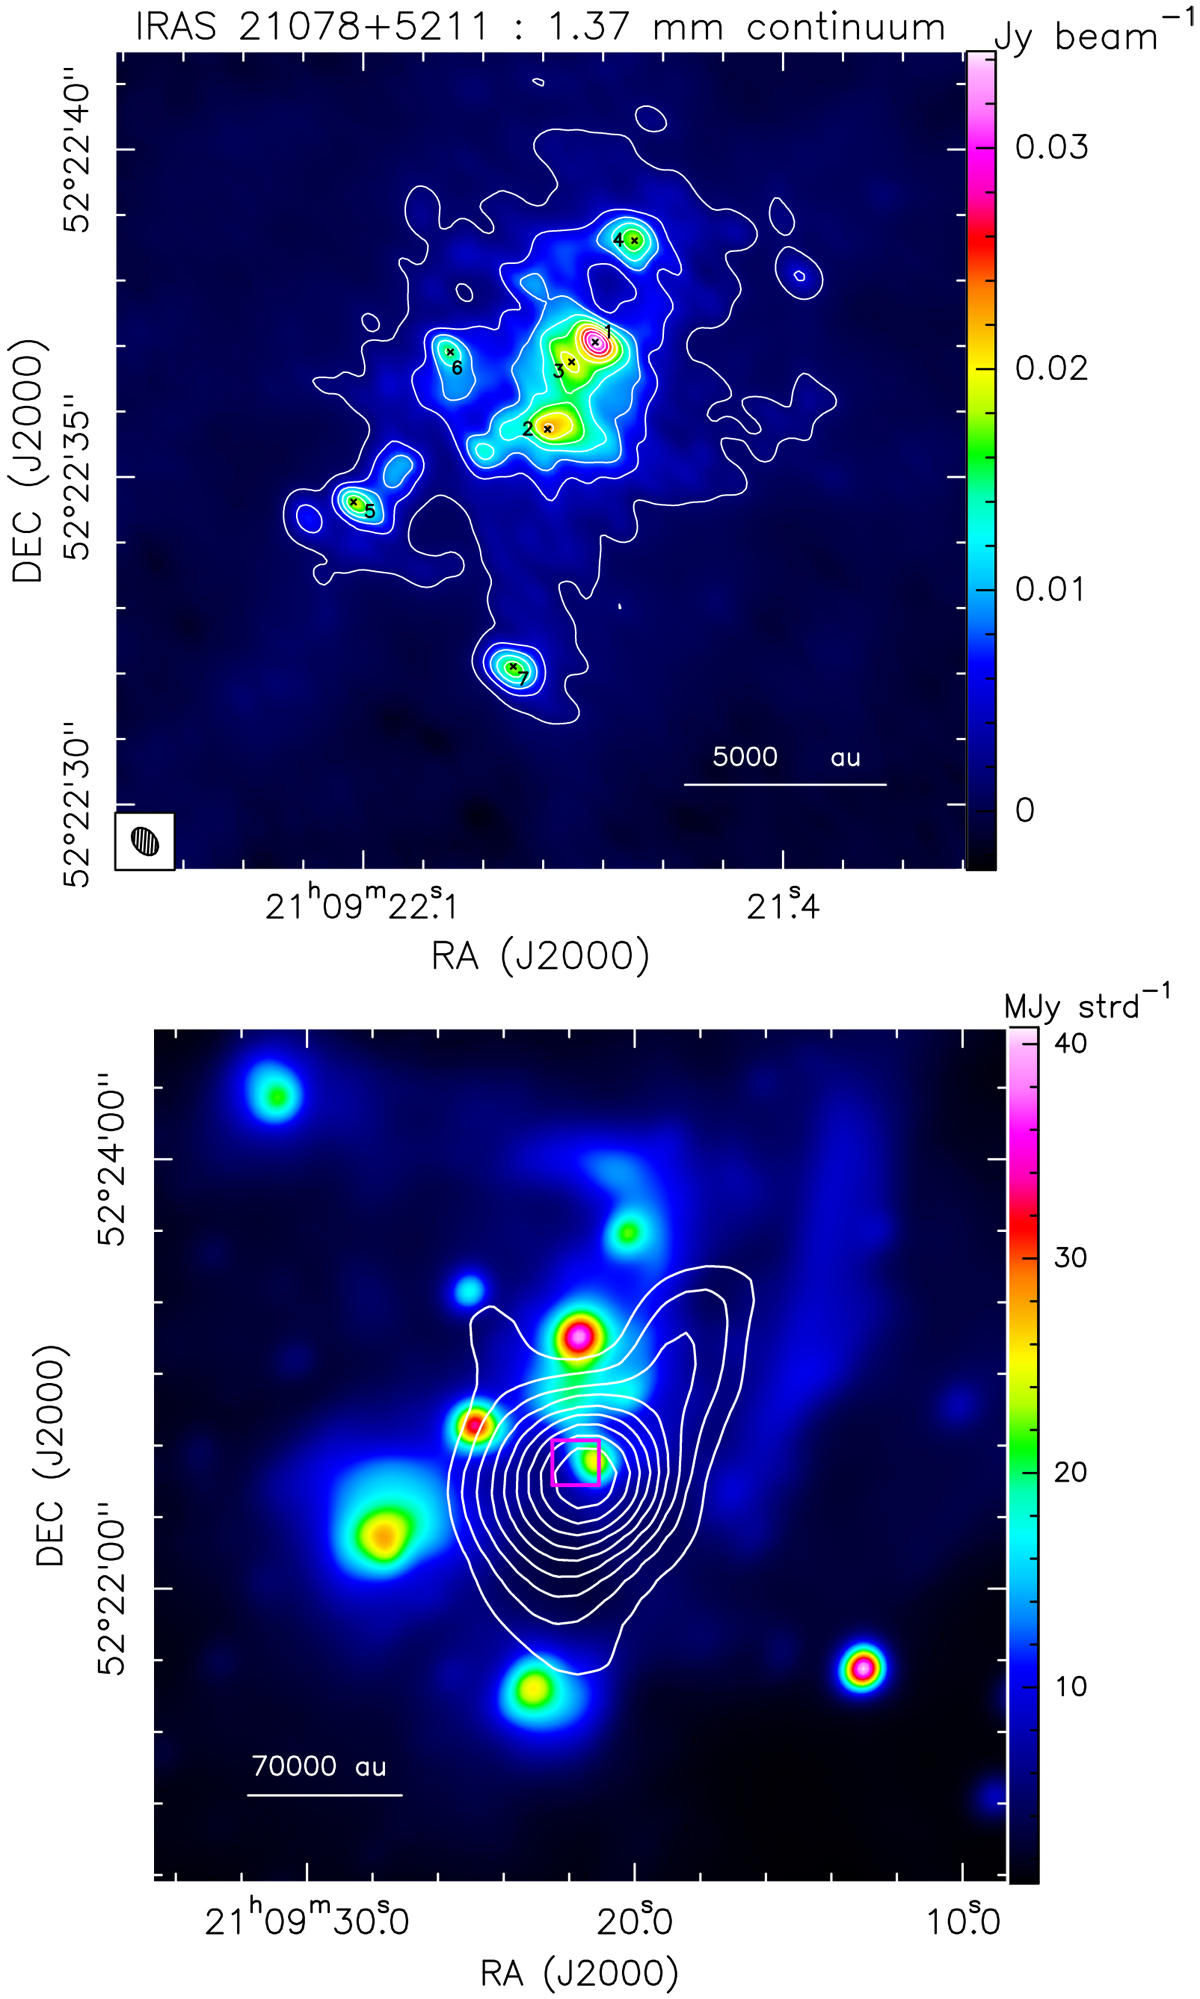
Upper panel: NOEMA 1.37 mm continuum emission (color map) of IRAS 21078+5211. The white contours correspond to levels ranging from 3σ (σ = 0.5 mJy beam−1) to the peak intensity of 35 mJy beam−1, in steps of 7σ. The little black crosses indicate the positions of the seven strongest 1.37 mm peaks labeled as in Beuther et al. (2018, see Table 5), with label numbers ordered in intensity. The restoring beam of the 1.37 mm continuum map is shown in the lower left corner. Lower panel: Wide-field Infrared Survey Explorer (WISE) 4.6 μm image (color map, Wright et al. 2010) toward IRAS 21078+5211. The white contours represent the SCUBA 850 μm continuum (Di Francesco et al. 2008), showing 10 levels increasing logarithmically from 7σ (σ = 0.1 Jy beam−1) to 11.4 Jy beam−1. The magenta rectangle delimits the region plotted in the upper panel.
Current usage metrics show cumulative count of Article Views (full-text article views including HTML views, PDF and ePub downloads, according to the available data) and Abstracts Views on Vision4Press platform.
Data correspond to usage on the plateform after 2015. The current usage metrics is available 48-96 hours after online publication and is updated daily on week days.
Initial download of the metrics may take a while.