Fig. 7.
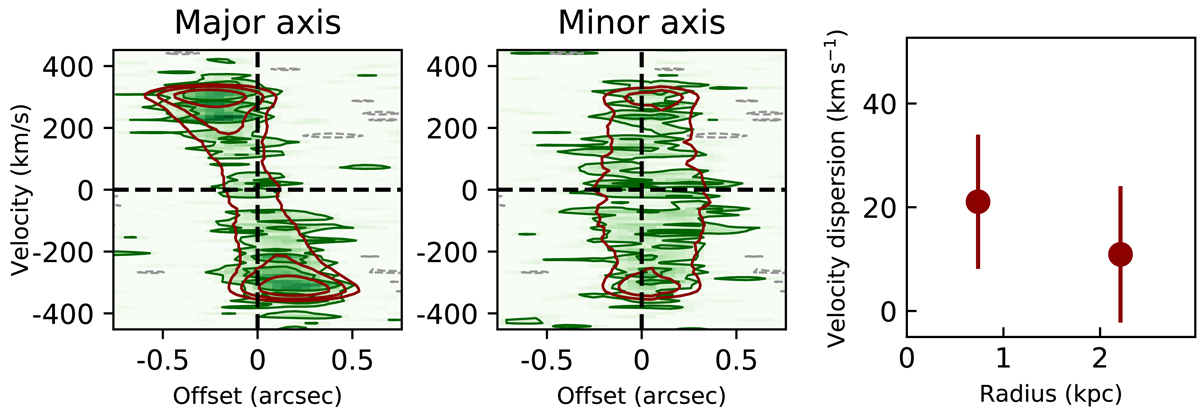
Data and best-fit 3DBAROLO model of AzTEC/C159 at high spectral resolution. Left panel: position-velocity diagram along the kinematic major axis of AzTEC/C159 (see Fig. 1) obtained using the high spectral resolution data cube (Table 3). The [C II] 158-μm emission in the data is in green shades and contours, while the 3DBAROLO model is in red contours. Contour levels are at −2, 2, 4, and 8 times the rms noise per channel. Centre panel: position-velocity diagram along the kinematic minor axis displayed analogously to the major-axis plot. Right panel: [C II] velocity dispersion obtained from the high spectral resolution data cube.
Current usage metrics show cumulative count of Article Views (full-text article views including HTML views, PDF and ePub downloads, according to the available data) and Abstracts Views on Vision4Press platform.
Data correspond to usage on the plateform after 2015. The current usage metrics is available 48-96 hours after online publication and is updated daily on week days.
Initial download of the metrics may take a while.