Fig. 6.
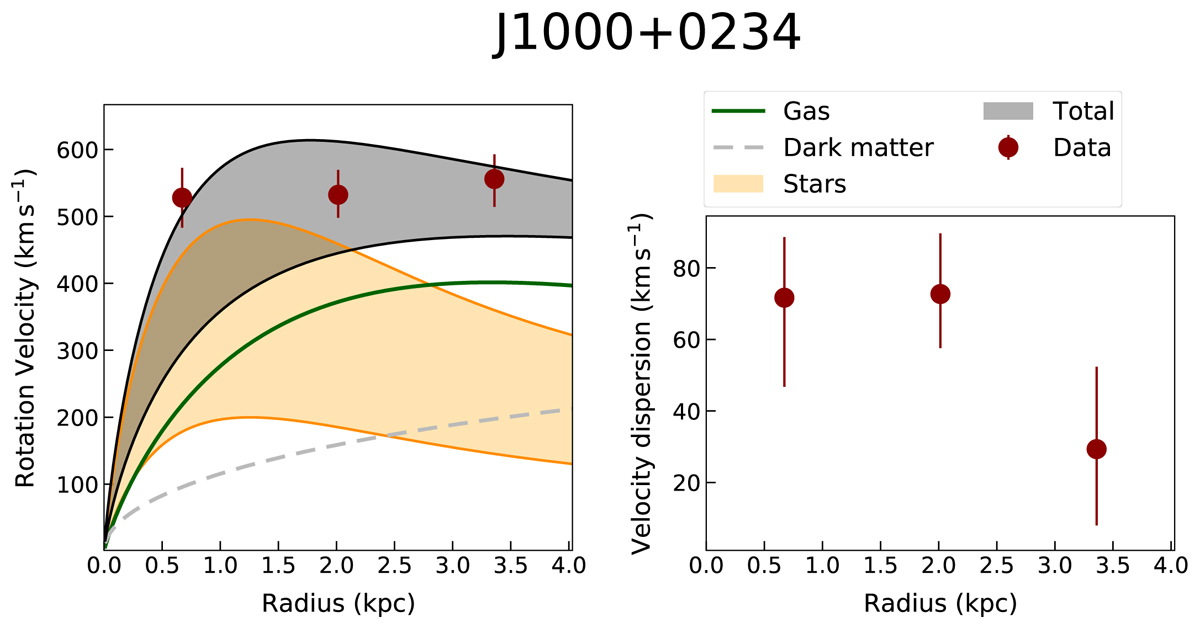
Best-fit rotation velocities and velocity dispersions of J1000+0234. Left panel: rotation velocities measured in J1000+0234 (red points) compared to the contributions of different matter components. This comparison is illustrative and not fitted to the data points. Orange lines and shades indicate the contribution of the stellar component given the two estimates of stellar mass present in the literature. The solid green curve indicates the contribution of the gas disc, which is assumed exponential and is derived from the [C II] 158-μm distribution. The dashed grey curve indicates the contribution of a dark matter halo given by an NFW profile with a virial mass of M200 = 2 × 10¹² M⊙. The black lines and shade indicate the total contribution of all components. Right panel: [C II] velocity dispersion measured in J1000+0234.
Current usage metrics show cumulative count of Article Views (full-text article views including HTML views, PDF and ePub downloads, according to the available data) and Abstracts Views on Vision4Press platform.
Data correspond to usage on the plateform after 2015. The current usage metrics is available 48-96 hours after online publication and is updated daily on week days.
Initial download of the metrics may take a while.