Fig. 3.
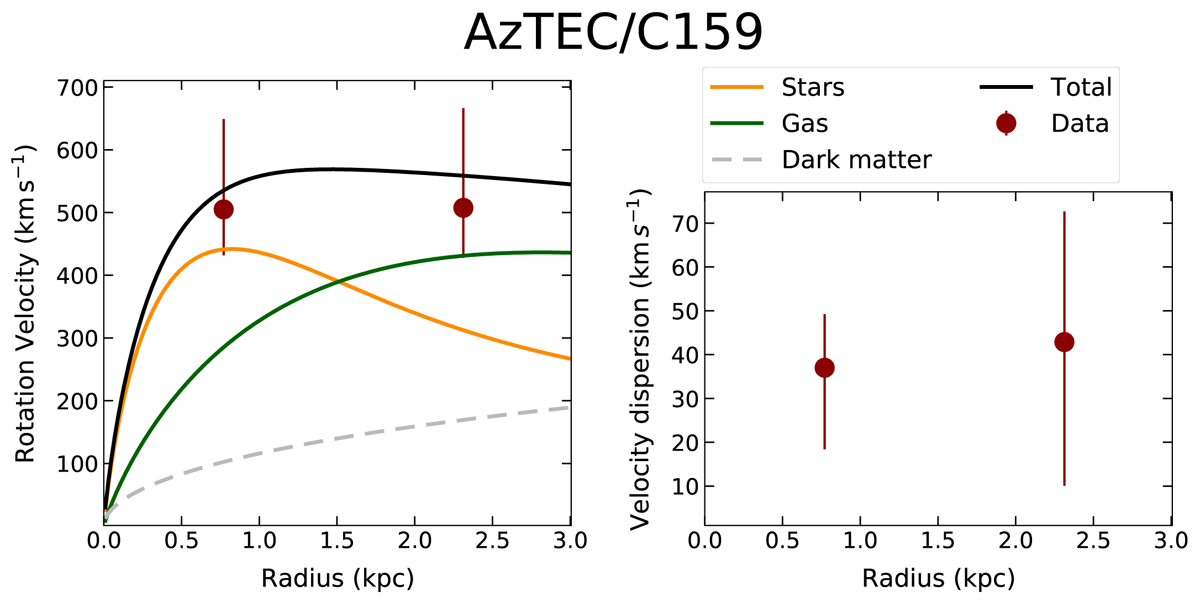
Best-fit rotation velocities and velocity dispersions of AzTEC/C159. Left panel: rotation velocities of the two annuli in which we decomposed the disc of AzTEC/C159. The orange and green curves show the contribution of stars and gas, respectively, modelled as exponential discs, the dashed grey curve shows that of a dark matter halo modelled as an NFW profile, and the black curve is the sum of all components. This comparison is illustrative and not fitted to the data points. Right panel: gas velocity dispersion in the two annuli obtained using the low spectral resolution data cube (see Sect. 3.5 for the high-resolution values).
Current usage metrics show cumulative count of Article Views (full-text article views including HTML views, PDF and ePub downloads, according to the available data) and Abstracts Views on Vision4Press platform.
Data correspond to usage on the plateform after 2015. The current usage metrics is available 48-96 hours after online publication and is updated daily on week days.
Initial download of the metrics may take a while.