Fig. 2.
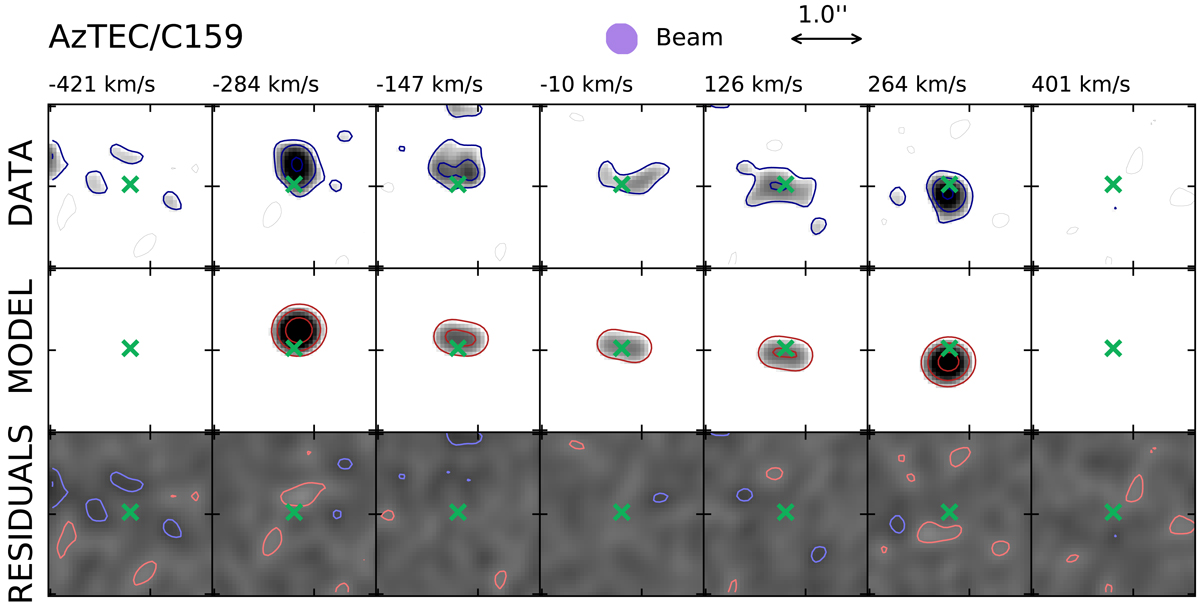
Comparison between data and 3DBAROLO best-fit model for AzTEC/C159. Top row: seven representative channel maps showing the [C II] 158-μm emission of AzTEC/C159 (low spectral resolution data cube; see Table 3). The contours are at −2, 2, 4, and 8 times the rms noise per channel (σ). Line-of-sight velocities with respect to systemic velocity (set at v = 0) are shown on top of each channel map. Middle row: channel maps of the axi-symmetric best-fit model obtained with 3DBAROLO; the contours are at the same levels as in the data. Bottom row: residuals (data minus model); pink contours are negative (−2σ), and light blue contours are positive (+2σ). In all panels, the green cross shows the dynamical centre, whose coordinates are given in Table 1.
Current usage metrics show cumulative count of Article Views (full-text article views including HTML views, PDF and ePub downloads, according to the available data) and Abstracts Views on Vision4Press platform.
Data correspond to usage on the plateform after 2015. The current usage metrics is available 48-96 hours after online publication and is updated daily on week days.
Initial download of the metrics may take a while.