Fig. 1.
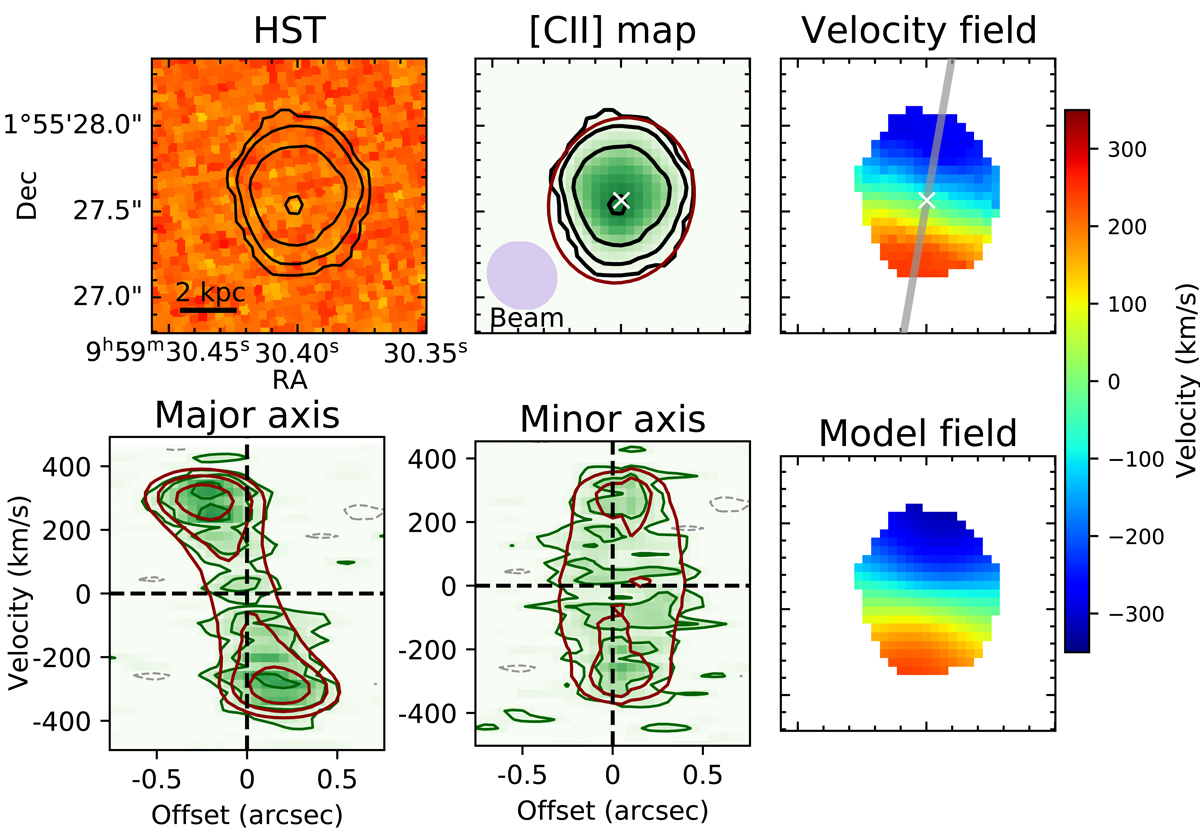
[C II] 158-μm observations and modelling of AzTEC/C159. Top left panel: HST F814W image with the [C II] 158-μm total-flux map contours overlaid; the source is not detected by HST. Top middle panel: total-flux map (green shape and black contours) of the [C II] 158-μm emission; the lowest contour is at about 2.5 times the rms noise in this map, and the other contours are at 2, 4, and 8 times this level. In red we show the outer contour of the total-flux map of the model obtained with 3DBAROLO (convoluted with the observational beam, shown in the bottom left corner). Top right panel: velocity (weighted-mean) field of the [C II] 158-μm line. Bottom left panel: position-velocity diagram along the kinematic major axis of the galaxy (grey line across the velocity field); the data are in green shades and contours, while the best-fit 3DBAROLO model is in red contours. Contour levels are at −2, 2, 4, and 8 times the rms noise per channel. Bottom centre panel: position-velocity diagram along the kinematic minor axis of the galaxy displayed analogously to the major-axis plot. Bottom right panel: velocity (weighted-mean) field of the best-fitting 3DBAROLO model.
Current usage metrics show cumulative count of Article Views (full-text article views including HTML views, PDF and ePub downloads, according to the available data) and Abstracts Views on Vision4Press platform.
Data correspond to usage on the plateform after 2015. The current usage metrics is available 48-96 hours after online publication and is updated daily on week days.
Initial download of the metrics may take a while.