| Issue |
A&A
Volume 647, March 2021
|
|
|---|---|---|
| Article Number | A120 | |
| Number of page(s) | 14 | |
| Section | Galactic structure, stellar clusters and populations | |
| DOI | https://doi.org/10.1051/0004-6361/202039797 | |
| Published online | 18 March 2021 | |
Quantifying the fine structures of disk galaxies with deep learning: Segmentation of spiral arms in different Hubble types
ICRAR, M468, The University of Western Australia, 35 Stirling Highway, Crawley, Western Australia 6009, Australia
e-mail: This email address is being protected from spambots. You need JavaScript enabled to view it.
Received:
30
October
2020
Accepted:
28
December
2020
Abstract
Context. Spatial correlations between spiral arms and other galactic components such as giant molecular clouds and massive OB stars suggest that spiral arms can play vital roles in various aspects of disk galaxy evolution. Segmentation of spiral arms in disk galaxies is therefore a key task when these correlations are to be investigated.
Aims. We therefore decomposed disk galaxies into spiral and nonspiral regions using the code U-Net, which is based on deep-learning algorithms and has been invented for segmentation tasks in biology.
Methods. We first trained this U-Net with a large number of synthesized images of disk galaxies with known properties of symmetric spiral arms with radially constant pitch angles and then tested it with entirely unknown data sets. The synthesized images were generated from mathematical models of disk galaxies with various properties of spiral arms, bars, and rings in these supervised-learning tasks. We also applied the trained U-Net to spiral galaxy images synthesized from the results of long-term hydrodynamical simulations of disk galaxies with nonsymmetric spiral arms.
Results. We find that U-Net can predict the precise locations of spiral arms with an average prediction accuracy (Fm) of 98%. We also find that Fm does not depend strongly on the numbers of spiral arms, presence or absence of stellar bars and rings, and bulge-to-disk ratios in disk galaxies. These results imply that U-Net is a very useful tool for identifying the locations of spirals arms. However, we find that the U-Net trained on these symmetric spiral arm images cannot predict entirly unknown data sets with the same accuracy that were produced from the results of hydrodynamical simulations of disk galaxies with nonsymmetric irregular spirals and their nonconstant pitch angles across disks. In particular, weak spiral arms in barred-disk galaxies are properly segmented.
Conclusions. These results suggest that U-Net can segment more symmetric spiral arms with constant pitch angles in disk galaxies. However, we need to train U-Net with a larger number of more realistic galaxy images with noise, nonsymmetric spirals, and different pitch angles between different arms in order to apply it to real spiral galaxies. It would be a challenge to make a large number of training data sets for such realistic nonsymmetric and irregular spiral arms with nonconstant pitch angles.
Key words: galaxies: fundamental parameters / galaxies: kinematics and dynamics / galaxies: structure
© ESO 2021
1. Introduction
Spiral arms play various roles in disk galaxy evolution through their gravitational effects on disk field stars and gaseous dissipation associated with their hydrodynamical interaction with the interstellar medium (ISM). For example, cold gaseous components of disk galaxies can be strongly perturbed by gravitational potentials of spiral arms so that their densities and motions can be significantly changed (e.g., Fujimoto 1968; Roberts 1969; Egusa et al. 2017). Formation processes of giant molecular clouds (GMCs) within spiral arms and the mass functions of GMCs depend on the spiral arm properties (e.g., Tasker et al. 2015; Pettitt et al. 2020). Resonant dynamical interaction between spiral arms and disk field stars at corotation radii in disk galaxies can result in an angular momentum redistribution and the resultant radial migration of stars (e.g., Sellwood & Binney 2002). Dynamical heating of stars by spiral arms themselves can increase the velocity dispersion of stars and thus cause the weakening of spiral arms (Sellwood & Carlberg 1984; but see Fujii et al. 2011; D’Onghia et al. 2013 for more recent results on the longevity of spiral arms).
Many observational studies quantified the detailed properties of spiral arms, for instance, numbers, pitch angles, shapes (e.g., grand design or flocculent), and amplitudes (e.g., Elmegreen & Elmegreen 1984; Rix & Zaritsky 1995; Seigar & James 1998; Kendall et al. 2008; Davis et al. 2012) and also revealed physical correlations between these arm properties and other galactic properties such as bulge-to-disk ratios and massive black hole masses (e.g., Kennicutt 1981; Seigar et al. 2008; Davis et al. 2017). Previous theoretical studies and numerical simulations indeed demonstrated that these physical properties of spiral arms can depend on the physical properties (e.g., Q parameters) of galactic disks because the effectiveness of spiral formation mechanisms are controlled by the disk properties (e.g., Athanassoula 1984; Carlberg & Freedman 1985; Grand et al. 2013; see Dobbs & Baba 2014 for a recent review). Recently, statistical studies of spiral arm properties based on a large number of galaxy images from the Galaxy Zoo project have been made, which provides new clues for the origin of spiral arms in disk galaxies (e.g., Mastes et al. 2019). These observed properties of spiral arms have not only constrained competing theoretical models of spiral arms (e.g., Sellwood 2011), but also assisted astronomers in understanding various roles of spiral arms in galaxy evolution (e.g., Seigar et al. 2008). Thus, the details of spiral properties quantified for a large number of disk galaxies with different Hubble morphological types will enable us to make even more significant progress in understanding the formation processes of spirals and their physical roles in galaxy evolution.
Future large surveys of galaxies based on next-generation observational facilities such as LSST, TMT, and Euclid will generate a huge number of galaxy images in the nearby and distance universe: for example, the LSST will be able to observe about 20 billion galaxies. Because spiral arms and bars are the main galactic structures that drive galaxy evolution (e.g., Buta 2013), these future observations will provide an excellent large data set for the various properties of spiral galaxies. Automated classification and quantification of spiral arms in disk galaxies will therefore greatly assist astronomers in understanding the physics of the dynamical evolution of spiral galaxies based on the statistical properties of the galaxies. Davis & Hayes (2014) have recently developed a new automated spiral extraction method and applied it to nearly 30 000 galaxies taken from the Galaxy Zoo project (Lintott et al. 2008). Their methods for spiral arm segmentation are not based on convolutional neural networks (CNNs), which have been widely used in recent image analyses of galaxies (e.g., Dieleman et al. 2015; Huertas-Company et al. 2015; Dominguez Sanchez et al. 2018).
A new architecture of CNNs (U-Net) for biomedical image-segmentation tasks has recently been developed (Ronneberger et al. 2015) and is now widely used for various purposes of image analysis not only in biology, but also in other areas of research. In spite of its power and great performance in image segmentation tasks, U-Net has not been widely used in galaxy image analysis so far. Boucaud et al. (2020) applied U-Net to galaxy images from the CANDELS survey in order to separate two (or multiple) galaxies from blended galaxy systems (e.g., interacting galaxies or similar apparent locations of two galaxies at different z by chance). If U-Net can separate spiral arms from other axisymmetric (e.g., exponential disks) or nonaxisymmetric (e.g., bars) components in disk galaxies, then astronomers can investigate whether the locations of spiral arms are correlated with intense star-forming regions or the locations of giant molecular clouds (GMCs) and thereby gain better understanding of galaxy-scale star formation and GMC formation processes triggered by spiral arms.
The purpose of this paper is to locate spiral arms in disk galaxies with different Hubble morphological types using U-Net. In this first paper, we assess the capability of U-Net to distinguish between spiral and nonspiral regions of disk galaxies using a larger number of synthesized images from initial spiral galaxies in computer simulations (i.e., not observed images of spirals). These clean images do not contain any noise, nearby stars, or external disturbances from galaxy interaction and environmental effects so that we can better assess the capability of U-Net for spiral segmentation task. If U-Net can properly identify and locate spiral arm structures in these clean images, then we can conclude that U-Net is a promising tool for spiral segmentation and thus will be able to be used for spiral segmentation in real images of galaxies or synthesized images of galaxies from more complicated cosmological simulations of galaxy formation. If it cannot accomplish this, we would need to look for alternative ways for spiral arm segmentation. Our previous studies used CNN to find fine structures in S0s (Diaz et al. 2019), barred spiral galaxies (Cavanagh & Bekki 2020), and outer gas disks of spiral galaxies (Shah et al. 2019). The CNN architectures (U-Net) used in the present work are quite different from those used in these previous works.
2. Model
The adopted mass distributions of stellar disks and bulges are the same as we used in our previous N-body and hydrodynamical simulations of disk galaxies (e.g., Bekki 2014a, 2015). We generated a large number of disk galaxy models with different properties of spiral arms represented by numerous particles, as done in our previous simulations. The mass distributions of spiral arms are based on logarithmic spiral arm models, which are more mathematical. These models of spiral galaxies can generate a large (∼50 000 in total) number of clean images of galaxies, which we think suitable for assessing the capability of U-Net of segmenting spiral arms in disk galaxies.
2.1. Stellar disks and bulges
A spiral galaxy is assumed to consists of dark matter halo, stellar disk, and spherical stellar bulge (no gas) in the present disk galaxy models. Because dark matter halos and kinematics of disk galaxies are not investigated at all in this study, we model only the structures of spiral galaxies. The total masses of stellar disk and stellar bulge in a disk galaxy are denoted as Md and Mbul, respectively, and the total stellar mass of a disk galaxy is denoted by Mgal. The spherical stellar bulge of a disk galaxy has a size of Rbul and a scale-length of R0, bul (=0.2Rbul) and is represented by the Hernquist density profile. The stellar disk with a size of Rd is represented by an exponential profile and the radial (R) and vertical (Z) density profiles are therefore proportional to exp(−R/R0) with scale length R0 = 0.2Rd and to sech2(Z/Z0) with scale length Z0 = 0.04Rd, respectively.
2.2. Logarithmic spirals, bars, and rings
The stellar disk is assumed to have spiral arms that are represented by logarithmic spiral arms adopted in previous models (e.g., Danver 1942; Ma 2001; Seigar & James 1998; Davis et al. 2012; Garcia-Gomez et al. 2017), and a spiral arm is described in the polar coordinate (r, θ) as follows:
 (1)
(1)
where a0 and b0 are the parameters that control the shape of a spiral arm. Because we consider that the spiral arms in a disk galaxy all extend to R = Rd (disk size), the maximum θ (θmax) should satisfy the following relation:
 (2)
(2)
which gives the relation of a0 and b0. Some models have stellar bars, so that the above equation needs to be revised as follows:
 (3)
(3)
where Rbar is the size of a stellar bar. We mainly investigate the models with θmax ranging from 3.14 and 9.42 (i.e., π to 3π) for b0 = 0.5. The mass density of a spiral arm at R follows the adopted exponential density profile at R. The width of a spiral arm is represented by wsp, and it is assumed to range from 0.02 to 0.06Rd. The mass fraction of spiral arms in a disk galaxy (fsp = Msp/Mgal, where Msp is the total mass of the arms) is a free parameter that defines the strength (or the amplitude) of the arms. Each of multiple spiral arms is assumed to have the same shapes and mass distributions in this study, although this assumption is not realistic.
A stellar bar is modeled as a Ferrer two-dimensional bar with n = 1, and the boundary d(x, y) within which stars are considered to belong to the bar is described as follows:
 (4)
(4)
where abar and bbar are the lengths of the major and minor axes, respectively. If this d(x, y) is less than 1 at a particle position (x, y), then the particle is regarded to lie within a bar. It should be stressed that this equation defines the boundary of the stellar bar, and a particular type of the particle distribution within the bar (e.g., exponential profile) can still be chosen. The mass density distribution within a bar of a disk galaxy is here assumed to follow the adopted exponential profile of the disk. The axis ratio of a bar (Abar = bbar/abar) is assumed to be a key free parameter that controls the shape of the bar. This model is the same as was adopted by Garcia-Gomez et al. (2017), although we investigate the Ferrer models with n = 1 only. The mass fraction of a stellar bar in a disk galaxy (fbar = Mbar/Mgal, where Mbar is the total mass of the bar) is a free parameter that defines the strength of the bar.
We also constructed the barred spiral galaxy models with inner rings around bars in order to investigate whether U-Net can distinguish between spiral arms with low pitch angles and inner rings. This is a tough test, but we can better understand the capability of U-Net of segmenting spiral arms in disk galaxies using these galaxy images with bar, spirals, and rings. We assumed that the size of a ring (Rring) in a barred spiral galaxy is the same as the bar length (Rbar). The ring was assumed to be circular with a width of 0.05Rd and a uniform mass distribution within the ring. The mass fraction of a ring (Mring/Mgal, where Mring is the total mass of the ring) was assumed to be fixed at 0.1 and is represented by fring. We investigated barred spiral galaxies with or without rings around bars. The brief descriptions of these model parameters for disk galaxies are given in Table 1.
Description of physical meanings for symbols.
2.3. U-Net
U-Net was developed for precise and efficient segmentation of biomedical images (Ronneberger et al. 2015) and has been widely used for various purposes. We here use U-Net to segment spiral arms of disk galaxies as precisely as possible. We applied U-Net to spiral galaxy images after we modified the final layer of the original architecture (Ronneberger et al. 2015). The details of the adopted architecture with layer types, input dimensions, weight shapes, activation functions, etc. are described in Fig. 1. We show the results only from this architecture in Fig. 1 because it can precisely segment the spiral arms in disk galaxies, as we show below. We do not intend to discuss how the different architectures can improve the precision of spiral segmentation in this study.
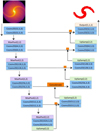 |
Fig. 1. U-Net architecture adopted in the present study. Rectangular boxes with different colors represent 2D convolutional (blue), maximum pooling (purple), up-sampling (green), and output (orange) layers. The input image (2D density map of a spiral galaxy) is processed in these layers counterclockwise along this U-shaped architecture, and the dimensions of input and output data (channel numbers, etc.) are shown within each box for each layer. The two 3 × 3 2D convolutional layers with a ReLU each are followed by a 2 × 2 maximum pooling layer, and this image processing is repeated at the left (contracting). In the right (expanding) part of U-Net, the output from a convolutional layer is concatenated with that from an up-sampling layer, and this concatenation is indicated by orange rectangles. For example, two 2D convolutional layers with 128 channels within the third block from top in the right part of U-Net are followed by an up-sampling layer, and the output of the up-sampling layer is concatenated with the output from the second convolutional layer with 64 channels within the second block from top in the left part of U-Net, and then input into the first convolutional layer with 64 channels within the second block from the top at the right. A sigmoid activation function rather than softmax is used in the final output layer in the present segmentation tasks of spiral arms. |
Because we adopted the sigmoid (rather than softmax) activation function (which outputs real numbers ranging from 0 to 1, i.e., not 0 or 1 for classification) in the final layer, we considered how each pixel might be classified into a spiral or nonspiral region. We considered that the output value for each pixel is higher than a threshold value (Pth). The pixel can then be classified as a spiral region. We mainly investigated models with Pth = 0.5 because the results do not depend strongly on Pth. We trained U-Net for 30 epochs for each set of models because 30 epochs are enough for the adopted U-Net to be well trained for a precise segmentation (Fm > 0.97). Table 2 summarizes the six sets of disk galaxies models that we used to generate the synthesized images of galaxies on which we trained U-Net. In order to train and test U-Net, we used the publicly available code Keras (Chollet 2015) with a collection of neural network libraries for deep learning. We trained U-Net with the NVIDIA GPU GTX1080 on the Magellan GPU cluster at the University of Western Australia.
Summary of the parameter values in training data sets for U-Net.
2.4. Normalized mass density maps
The input image data of a spiral galaxy are the surface mass density of stars (Σ on a logarithmic scale) in this study. We generated galaxy images in the same way as we did in our previous works to apply deep learning to galactic mass distributions (Bekki et al. 2019; Bekki 2019; Shen & Bekki 2020). The method is described in Bekki (2019), and we here briefly describe it. We first divide a galaxy into 64 × 64 regions (pixels) and thereby estimate the surface mass density at each pixel using a Gaussian smoothing kernel with the smoothing length of 0.03Rd. The image size of an observed real galaxy (i.e., the frame size of a post-stamp image) can be significantly larger than the apparent size of the galaxy. We accordingly consider that the size ratio of the image to the disk is a free parameter represented by Rf. Here, we mainly investigate the models with Rf = 1 (where Rd is the disk size and fixed at 1 for convenience). Each 2D Σ map has 64 × 64 pixels and Σ is normalized using all pixel values so that the minimum and maximum density can be 0 and 1, respectively.
The pixel size was 0.03Rd for Rf = 1, which corresponds roughly to 0.5 kpc for a Milky Way-type disk galaxy. The location of each pixel in an image is specified by i (x-direction; 1 ≤ i ≤ 64) and j (y-direction; 1 ≤ j ≤ 64), and the normalized 2D density map at (xi, yj) can thus be derived as follows:
 (5)
(5)
where Σmin and Σmax are the minimum and maximum values of Σ, respectively, among the 64 × 64 pixels in a model for a given projection. Therefore the normalization factor is different in different spiral galaxy models with different spiral arm properties viewed from different projections. A spiral galaxy is viewed from 100 different angles in the preset study.
2.5. Prediction accuracy evaluation
We investigated how accurately the adopted U-Net can predict the locations of spiral arms for each synthesized image using the following metrics. Each pixel in a galaxy image was given a component identifier, I, which was 1 or 0 depending on whether it was part of spiral region (1) or nonspiral region (0). When this I for a pixel of the predicted image was the same as I for the same pixel of the original (ground truth) image, then the prediction accuracy indicator, P, was given 1 for the pixel, otherwise, P was given 0. the mean F (Fi) of ith image is given as follows:
 (6)
(6)
where np is the total number of pixels (=64 × 64 = 4096) in an image and Pk is the P value at kth pixel. It should be noted here that this is similar to the standard F-score but still different. When we assume that spiral and nonspiral regions are defined as positive (P) and negative (N), respectively, then spiral and nonspiral regions that are classified as spiral regions are labeled TP (true positive) and FP (false positive), respectively, in the standard F-score, whereas spiral and nonspiral regions that are classified as nonspiral regions are labeled FN (false negative) and TN (true negative), respectively. We did not use the F-score that is defined as  because we need to select both spiral and nonspiral regions that are correctly segmented
We also separately investigated the prediction accuracy for spiral arm (Fi, sp) and nonspiral arm regions (Fi, nsp) for each ith image in order to discuss which of the two regions U-Net can predict P = 1 more often. By definition,
 (7)
(7)
where N(TP) and N(FN) are the number of pixels labeled TP and FN, respectively: this corresponds to a recall rate. Likewise,
 (8)
(8)
where N(TN) and N(FP) are the number of pixels labeled TN and FP, respectively.
In these prediction accuracy measurements, higher Fi in an image means that the locations of spiral and nonspiral regions are more accurately predicted for the image. We also estimated the average value of these F (Fm) for each spiral galaxy model set as follows:
 (9)
(9)
where Nm is the total number of images per model set (fixed at 1000). As done for Fm, the averages of these (Fm, sp and Fm, nsp) were estimated from all images in a set of models.
2.6. Training and testing U-Net
We trained U-Net using six different training data sets. We first used only 1000 synthesized images of nonbarred spiral galaxies with fixed N = 2 and wsp and variable fsp, θmax, and fbul to train U-Net. This U-Net and these spiral galaxy models are referred to as U1 and U1 models, respectively. Then we trained U2 using 5000 images of nonbarred galaxies with fixed wsp and variable N, fsp, θmax, and fbul. These U1 and U2 models mimicked late-type spiral galaxies with low bulge-to-disk ratios and different arm properties. We also trained U3, U4, and U5 by adding large bulges, wider spiral arms, central bars, and multiple arms with N = [6−8] to the galaxy models used in U2 models. Clearly, these U-Nets predict the location of spiral arms better for disk galaxies with different Hubble types because the training data sets themselves contain images of different Hubble types. The model parameters for these six model sets are summarized in Table 2.
We tested U-Net in the following two different ways. One way was the standard test in which (i) original images were divided into 80% and 20% data sets, (ii) U-Net was trained using the 80% data set and (iii) the trained U-Net was tested using the remaining 20% data set. The other test, which is much more important in this study, is that U-Net was tested using galaxy images synthesized from galaxy models that were not used to synthesize galaxy images on which U-Net was trained. In the first test, the training and testing images were synthesized from the same set of galaxy models. However, in the second test, galaxy models from which images were generated on which U-Net was trained are differed from those for testing U-Net. We focus more on this second test because the adopted ranges of galaxy models in this study should be limited: we cannot model all types of spiral galaxies with different spiral properties using a limited number of images (that should be put into U-Net). If the performance of U-Net is quite good in the second test, then we can consider that it is very promising in the segmentation of spirals arms in disk galaxies with different Hubble types.
2.7. Ranges of model parameters
We investigated a large number of spiral galaxy models with different properties of spiral arms, bars, bulges, and inner rings. We considered that the total mass of a disk galaxy (Mgal) is fixed at 1 for convenience in data processing as follows:
 (10)
(10)
where Md is the mass of the exponential disk (excluding bars, spirals, and rings in the disk). Therefore
 (11)
(11)
Each model was allocated the values of these parameters for given parameter ranges (e.g., 0.4 ≤ fsp ≤ 0.9) using a random number generator.
The most important parameter in this study is fsp, as discussed below. Following the results of recent numerical simulations of spiral galaxy evolution by Baba et al. (2013), we assumed a wide range of fsp. Although Baba et al. (2013) demonstrated that fsp (corresponding to their spiral amplitudes) ranges from 0.2 to 0.8 depending on the pitch angles, we investigated a wider range (0 < fsp < 0.9) than their predictions, mainly because the observed spiral arms appear to show a wider variety than the simulated ones.
We investigated a large number of testing models with different fsp, N, wsp, θmax (controlling pitch angles), fbul, fbar, Rbar, Rring, Abar, and Rf. Table 3 lists the values of these parameters for 23 testing data sets. Although wide ranges of these model parameters are explored in this study, the synthesized images of spiral arms, bars, and rings were all assumed to be symmetric, which is not realistic when compared to the observed spiral arms. These idealized models for spiral galaxies were adopted so that the capabilities of U-Net in the segmentation of spiral arms could be more quantitatively assessed. We will discuss the U-Net capabilities in this segmentation task using more realistic spiral arms models in our forthcoming papers if U-Net shows a very good performance for these idealized spiral models.
Summary of parameter values in testing data sets for U-Net.
3. Results
3.1. Nonbarred models
Figure 2 shows six examples of 2D density maps of spiral galaxies with N = [1−5] and a barred spiral galaxy with N = 2 viewed face-on. These clear images with symmetric spiral arms and no significant inhomogeneity in the exponential disks are input data sets (training data) that were used to train the adopted U-Net in this study, although these images are not realistic. The initial stellar disk in a spiral galaxy model was assumed to have its spin axis aligned with the z-axis, and 100 images were generated for different view angles, θ and ϕ, where θ is the angle between the z-axis and the line of sight, and ϕ is the azimuthal angle measured from the x-axis of the projection of the line of sight. Figure 3 shows nine example images with different θ for a fixed ϕ (=0°) in a non-barred spiral galaxy model with N = 2. In order to avoid almost edge-on views of disk galaxies, we considered that θ should be lower than 80°. Using these images with different θ and ϕ, we assessed the capability of U-Net in spiral arm segmentation tasks.
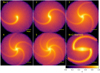 |
Fig. 2. Two-dimensional maps of surface mass densities (Σ on logarithmic scale) of spiral galaxies projected onto the x − y plane for six different models with different N and with and without stellar bars. The 2D densities are normalized (0 ≤ Σ ≤ 1). The disk size in these galaxy images is assumed to be 17.5 kpc. |
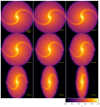 |
Fig. 3. Same as Fig. 2, but for nine snapshots of the same spiral galaxy model with N = 2 viewed from nine different angles (θ). |
Figure 4 demonstrates that the predicted (P) images of spiral arms are very similar to the ground truth (G) images in these U1 models with N = 2, which means that the U-Net model U1 can predict the locations of spiral arms very accurately. However, nonspiral regions close to the edges of the two arms are identified as arm regions in the three images. This misidentification (i.e., incorrect prediction) of arm regions can be seen in all models, although the probability of this misidentification is rather low (< 0.02 for most models) in this study. The mean accuracy (Fm) for this model is 0.987, which means that the prediction accuracy of U1 is very good. Figure 5 shows that the level of differences in the 2D Σ maps between predicted (segmented) spiral arms and ground truth ones in the best predicted image is similar to that for the worst predicted images, which again confirms the very good prediction accuracy of this U1. The worst predicted image is selected, mainly because the true spiral regions in the original (ground truth) image are not as well identified as such in the predicted image.
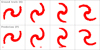 |
Fig. 4. 2D maps of two spiral arms in the original images (ground truth, or G; upper panel) and the predicted images of the arms from U-Net (P; lower panel) for the U1 models. These images are for θ = 0 and different ϕ. |
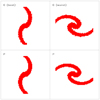 |
Fig. 5. Same as Fig. 4, but for the two sets of best (left) and worst images (right) for which the prediction accuracy (Fm) by U-Net is highest and lowest, respectively. |
Figure 6 clearly demonstrates that nonspiral regions in original images are more accurately predicted (Fm = 0.995) than spiral regions (0.939) in this model with N = 2. The edges of two spiral arms are more likely to be misidentified as nonspiral regions by U-Net, although the number of such misidentified pixels is small (only < 100 of 1638 spiral regions for fsp = 0.4). In this particular N = 2 late-type spiral model, the prediction accuracy (Fm) does not depend on the two inclination angles, fsp, θmax, and fbul, although the total number of training and testing images is small (1000). The lack of θ-dependence in this spiral segmentation based on U-Net means that there is no need to deproject galaxy images for this U-Net. This would be a remarkable advantage of this U-Net because other methods need to deproject galaxy images by assuming disk inclination and position angles.
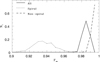 |
Fig. 6. Number distributions of images for all (Fm; solid), spiral arm regions (Fm, sp; dotted), and nonspiral arm regions (Fm, nsp; dashed) for the U1 models. The normalized number (Ni) of images for each Fm bin is shown. |
As shown in Fig. 7, the prediction accuracy of U-Net trained and tested by 5000 images with different N (U2) is rather high (0.982) for all testing images with different N: Fm distributions peak at Fm > 0.96. This U2 tends to predict less accurately (i.e., smaller Fm) for testing images with larger N, and the Fm distributions are likely to be broader for these images with larger N. The derived weak dependence on N strongly suggests that as long as a large number of images with different N are used to train U-Net, it can show great performance regardless of N.
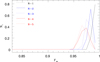 |
Fig. 7. Same as Fig. 6, but for all regions (Fm) in the U2 models with N = 1 (dotted black), 2 (solid blue), 3 (dotted blue), 4 (solid red), and 5 (dotted red). |
Figure 8 confirms that the 2D Σ maps of segmented spirals are very similar between the worst predicted image (Fm = 0.93) and the original. For the highly inclined disk with two spiral arms, it is slightly difficult for U2 to predict the locations of the two arms in the worst predicted image. As expected, for disks with one arm, it is easier for U2 to predict the location of the one arm in spiral galaxies owing to its simpler structure: in this best predicted case, Fm = 0.998. Figure 9 shows that nonspiral regions can be more accurately located by U2 than spiral regions, which is seen in U1 models as well. This means that the probability of spiral regions to be misclassified as nonspiral is higher than that of nonspiral regions to be misclassified as spirals. The peak locations of Fm distributions for spiral and nonspiral regions in U2 models are almost the same as those seen in U1 models. Figure 10 demonstrates that the prediction accuracy of our U-Net does not depend strongly on the adopted θ range.
When the spiral arms are segmented, their properties such as pitch angles, total masses, and arm numbers can be derived straightforwardly (e.g., Davis & Hayes 2014). It should be stressed here that this segmentation process by U-Net can be done very quickly even without using GPU. For example, the segmentation of 1000 testing images by U2 required only 40 s (i.e., 1500 images per minute) for a a Linux machine (Centos ver. 7.4) with an Intel i5-4570 CPU at 3.2 GHz frequency (which is not the latest CPU). Accordingly, roughly 2 × 10⁶ disk galaxy images can be processed and segmented by U-Net in one day. This means that when GPU machines are used for segmentation tasks by U-Net, then about 107 images can be segmented in one day by one standard GPU machine. Recently, Hewitt & Treuthardt (2020) estimated pitch angles of spiral arms using a new parallelized 2D fast Fourier transform algorithm (p2DFFT) and compared the new method with others. These standard FFT-based methods have been used to derive spiral properties, but the high speed of U-Net suggests that spiral arm properties can be derived from spiral arms segmented by U-Net very quickly as well.
3.2. Effects of stellar bars
The observed spiral galaxies show a much wider variety of spiral arm structures than the synthesized images of spiral galaxies in this study. Although the original 5000 images in U2 models were split into 4000 to train U-Net and 1000 to test it, these images were synthesized from disk galaxies with certain ranges of model parameters (e.g., N = [1, 5] and fbul < 0.1). Therefore it is not clear whether U-Net can predict the locations of spiral arms in galaxies with N ≥ 6 or fbul ≥ 0.2. If U2 can very accurately predict the locations of spiral arms in images of spiral galaxies that are not used to generate synthesized images to train U1 (i.e., entirely unknown data sets), then we can consider that U-Net is a powerful tool for the segmentation of spiral arms. Thus we here tested U1 using entirely unknown data sets.
The central stellar bars in spiral galaxies with N = 2 would make it more difficult for U-Net to predict the locations of the two arms because the two arms are connected to the similarly bisymmetric bars. Figure 11 compares the 2D distributions of original and predicted (segmented) spiral arms for four example images in T10 testing models. As expected, the parts of the inner stellar bars are misclassified as the parts of two spiral arms in these images, although Fm is still high in these images (Fm = 0.958 for the testing model T10). In the image of a highly inclined disk, the entire bar regions are misclassified as spirals, which would be a serious disadvantage of U-Net in the segmentation of spiral arms. The second image from the left in Fig. 11 shows nonspiral regions that are misclassified as spirals, although other images do not show this type of misclassification.
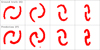 |
Fig. 11. Same as Fig. 4, but for testing images (T10) of barred spiral galaxies with N = 2. This segmentation was made by U2, which was trained on synthesized images of nonbarred galaxies. Nevertheless, the locations of segmented spirals appears to match those of the original (ground-truth) spirals well. |
We confirm that spiral arms in barred spiral galaxies with different N but a fixed fbul can be precisely segmented by U2 with Fm > 0.95 (see Table 3 for T10, T11, and T12 models). Furthermore, we found that bar sizes and shapes do not affect the prediction accuracy of U2 for spiral galaxies with a fixed fbul. For example, as shown in Fig. 12, U2 can precisely segment spiral arms for the two barred galaxies with Rbar = 0.2 and 0.5, although their Fbar distributions are slightly different for a narrow range of Fbar (> 0.85). Spiral arms of barred spiral galaxies with shorter bars are more likely to be precisely segmented in U2. These results imply that U-Net can be applied to barred and nonbarred spiral galaxies, although the stellar bar regions of barred spiral galaxies viewed almost edge-on can be misclassified as spiral arm regions by U-net. This misclassification problem of U-Net will need to be addressed in our future works using more complicated architectures of U-Net and a greater variety of spiral arm structures.
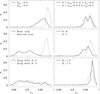 |
Fig. 12. Same as Fig. 6, but for 12 different testing data sets: different Rbar (T10 and T12; top left), fbul (T1 and T2; top right), wsp (T13 and T14; middle left), N (T15 and T16; middle right), ring models with different N (T17 and T18; bottom left), and different Rf (T21 and T22, bottom right). The U-Net used for these tests was trained on disk models that were not used to generate these images for testing. |
3.3. Parameter dependence
It is clear from Fig. 12 that bulge mass fractions do not affect the prediction accuracy of U-Net in the segmentation of spiral arms. It should be stressed here that these images were synthesized from large bulge models with 0.1 < fbul < 0.5 that were not used in the training phase of U2. Accordingly, this result suggests that U-Net can accurately predict the locations of spiral arms for disk galaxies with a wide variety of bulge types with different fbul, even if the U-Net is trained by galaxy images with a limited range of fbul. This is promising because it would be unrealistic to model all different galaxy morphologies in the universe using a huge number of galaxy images for these. Figure 12 also demonstrates that spiral arms in galaxy images with stronger arms can be more accurately segmented by this U2 in large bulge models.
As shown in Fig. 12, Fm depends on wsp such that it is lower for quite wide spiral arms with wsp = 0.06 (T13), corresponding to 30% of the disk scale length. Although the locations of spiral arms in these images with wide spiral arms are least accurately predicted, the mean Fm is still relatively good (∼0.9 for T13; see Table 3). We confirm that if galaxy images with wide spiral arms are included in the training data set for U-Net, then the trained U-Net can have a better prediction accuracy for these wide spiral arms (Fm = 0.952; see Table 2 for U5).
Although the shapes and the numbers of spiral arms in disk galaxies are observed to be widely different (e.g., Iye et al. 2019; Tadaki et al. 2020), ∼90% of these have N ≤ 5 (e.g., Hart et al. 2017). It is, however, an important test whether U-Net trained by images with a limited range of N in U2 models can predict the locations of spiral arms in galaxies with N > 5. Figure 12 shows that (i) the prediction accuracies for images with N = 6 and 7 are good (Fm > 0.93) and (ii) the Fm distributions are wider than those for N = [1−5]. The high accuracies obtained for N = 6 and 7 are surprising, given that the range of spiral arm numbers in the training data sets was limited in U2 models (N = [1−5]). These results again imply that a huge number of images with a large variety of N (e.g., N = [1−10] are not required to develop U-Net that can segment spiral arms accurately for disk galaxies with different N. Because the observed shapes of flocculent spiral arms are not modeled in this study, it remains to be clarified whether U-Net trained on galaxy images with symmetric spiral arms can accurately segment such flocculent arms.
We found that U2 can accurately segment spiral arms with Fm > 0.95 only if fsp > 0.2, that is, only when disk galaxies have stronger arms (see Table 3 for T3−T7). The prediction accuracy depends on fsp in such a way that Fm is higher for larger fsp: Fm = 0.761, 0.809, 0.887, and 0.954 for fsp = [0−0.05], [0.05−0.1], [0.1−0.2], and [0.2−0.3], respectively. These results imply that disk galaxies with weaker spiral arms, such as the so-called anemic spirals in the Virgo galaxy cluster, would not be able to be segmented well by U-Net. However, the prediction accuracy of 0.76 for very weak spiral arms is encouraging: still 76% of the spiral or nonspiral regions can be accurately located by U-Net.
Inner rings around stellar bars in barred spiral galaxies are found to slightly affect the prediction accuracy in our models with N = 2 and 4, fring = 0.1, and Rring = Rbar = 0.2 and 0.5. For example, Fm in the barred spiral models with a ring with Rring = 0.5 and N = 2 (4) are 0.903 (0.919), which is slightly lower than the similar model without rings (see Table 3 for T17 and T18). However, it should be noted here that Fm, sp and Fm, nsp in this barred spiral model with N = 2 and a ring are 0.982 and 0.891, respectively, which means that spiral regions are more accurately predicted by U2 than nonspiral regions. A minor fraction of nonspiral regions including the inner ring is misclassified as spiral arms, which means that inner rings can slightly lower the prediction accuracy of U-Net. The barred spiral models with fring = 0.1 and Rring = 0.2 show rather high Fm of 0.976 for N = 2 and 0.972 for N = 4, which means that smaller rings cannot significantly affect the prediction accuracy of U-Net. The Fm distributions for these two testing data sets are significantly broader than other models sets.
Galaxy sizes can be significantly smaller than the sizes of postage-stamp images, which we need to use when we apply U-Net to real observations. However, the sizes of testing images are the same as those of galactic disks in all of the models shown so far. Therefore we investigated how the prediction accuracy of U-Net can be affected by the ratios of galactic disks to images sizes (frame sizes). Figure 12 confirms that Fm is rather high (> 0.97) for Rf = 1.2, 1.5, and 2.0 (see Table 3 for T21, T22, and T23). This is a promising result because we do not need to adjust the image sizes so that they can be similar to galactic disk sizes (e.g., by cutting the images properly).
This shows that even though these testing images were synthesized by using disk galaxy models that were not used to generate the training data sets for U2, Fm of U2 are overall good for these testing images. Furthermore, U3−U5, which were trained using different sets of disk galaxy models, show very good prediction accuracies (Fm > 0.98: see Table 2). Although these results are all promising, it is a fundamental question whether U-Net trained by a limited number of images from a limited number of disk galaxy models can really segment all different types of spiral arms in disk galaxies with different Hubble types in a very accurate manner. This question will be addressed when several features of spiral arms that were not modeled in this study (e.g., flocculent shapes, nonsymmetry, nonconstant pitch angles, and unequal spacing of arms) are properly considered in generating spiral arms in disk galaxies.
4. Discussion
4.1. Tests using hydrodynamical simulations of disk galaxies
The present study is based on many images of spiral galaxies that are based on mathematical models (i.e., symmetric and regular spiral arms). Since these images are less realistic compared to the observed spiral galaxies with asymmetric and irregular spiral arms, here we discuss how we improve our segmentation models using more realistic spiral galaxy images.
4.1.1. Limitations and further improvement
Although we have clearly demonstrated that U-Net can predict the precise locations of spiral arms in disk galaxies with different Hubble types, the following assumptions in the adopted spiral models might lead to worse predictions of the locations of spiral arms in the application of U-Net to real observations. First, all images we used were assumed to be symmetric, which is not realistic. This means that when U-Net is applied to spiral galaxies with different pitch angles between different arms, then the prediction accuracy can be lower when U-Net is applied to real observed images. Moreover, when spiral galaxies have lopsided distributions of stars, U-Net might predict the locations of spiral arms less accurately. Second, no localized density enhancement along arms was considered in disk galaxies for simplicity and clarity. Formation of massive OB stars in some areas of spiral arms can significantly enhance the luminosity densities of the ares so that the arm can have bright knotty region. These knotty star-forming regions in the arm can make it more difficult for U-Net to identify global spiral arms in disk galaxies.
Third, two spiral arms in a barred spiral galaxy were assumed to originate from the two edges of the bar. Although the observed images of barred spiral galaxies suggest that this assumption is quite reasonable and realistic, some of these galaxies have secondary bars. Because inner secondary bars within primary bars were not modeled at all, U-Net might not predict the locations of spiral arms in disk galaxies with these fine structures. Fourth, only logarithmic spiral arms with N = 1−8 and different pitch angles were modeled. Accordingly, U-Net would not be able to predict the locations of flocculent spiral arms observed in a significant fraction of spiral galaxies precisely (Elmegreen 1981).
4.1.2. Three different types of simulated spiral galaxies
In order to discuss whether U-Net trained on the present models for symmetric spiral arms with constant pitch angles can predict the locations of nonsymmetric and irregular spiral arms with their pitch angles depending on the arm positions well, we here use the results of our original hydrodynamical simulations of disk galaxies (Bekki 2013, 2014b). The code of the simulations enables us to investigate the evolution of neutral and molecular hydrogen gas, metals, and dust in disk galaxies in a fully self-consistent manner. The details of the code are given in Bekki (2013, 2015, 2017). We investigated three different spiral galaxies, labeled S1, S2, and S3. S1 is a gas-rich Milky Way-type luminous disk galaxy with a gas mass fraction (fg) of 0.1, and this mimics the present-day gas-rich late-type disk galaxies. S2 mimics high-z very gas-rich spiral galaxies with clumpy gas distributions in which fg was set to be 0.45. S3 with fg = 0 mimics barred galaxies with very week spiral arms that are being transformed into S0s through disk heating by spiral arms.
In these three models, disk galaxies consist of dark matter and stellar and gaseous disks, and the disk galaxy models are the same as those adopted in Bekki (2014b). The dark matter masses were set to be 1012 M⊙ for all models. The stellar disk mass is 6 × 10¹⁰ M⊙ for S1 and S3 and 3 × 10¹⁰ M⊙ for S2. After 3 Gyr evolution of these models, snapshots at all time steps were inspected by eye, and accordingly, three snapshots with spiral arms were selected for each of the three disk models. These three images were labeled, for example, S1−1, S1−2, and S1−3 for the S1 model. The 2D maps of mass distributions were then input into U-Net model U4 (see Table 2), which was trained on a large number of images from barred spiral galaxy models. Figures 13–15 describe the locations of segmented spiral arms in the x − y plane for these nine images.
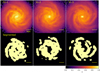 |
Fig. 13. Two-dimensional density maps of the spiral galaxy model S1 for three different time steps (S1−1, S1−2, and S1−3; upper panel) and the projected distributions of the segmented spiral arms (lower panel). For clarity, the pixels that are identified as the parts of spiral arms are shown as logΣ = 1 (i.e., highest density; yellow). Other pixels are shown as logΣ = 0 (i.e., lowest density; black). |
Clearly, the simulated spiral arms are irregular and much less symmetric, with pitch angles being different depending on the positions of the arms, which are in a striking contrast with those shown in Sect. 3. Nevertheless, Fig. 13 shows that at least some spiral arms with high stellar densities are well segmented by U-Net. In S1−1 and S1−2, the central small short bar (and bulge) is not misclassified as spiral arms, but the central bar in S1−3 is identified as the root of the inner spiral arm. Because spiral arms are observed to originate from the central bars in real galaxies, this misidentification problem would need to be addressed in our future U-Net with more complicated architectures for better segmentation processes. Furthermore, the low-density tips of spiral arms are not well segmented by U-Net. This is expected because U-Net does not show great performance in our mathematical spiral galaxy models with weak arms. The outer spiral arms with low stellar mass densities are likely to be missed in this segmentation processed based on U-Net.
As shown in Fig. 14, clumpy spiral arms are relatively well segmented by U-Net, although the central high-density bulge regions are misidentified as parts of the arms in these clumpy spiral S3 images. Furthermore, massive clumps formed in spiral arms are also identified as parts of the arms, which appears to be inevitable in this segmentation process. As a result of this, the spatial distributions of the segmented spiral arms do not look like spirals, although the original 2D images clearly look like spirals. It would be a matter of debate whether clumps formed from spiral arms should be regarded as parts of spirals. However, these results for S2 strongly suggest that we need to improve the performance of U-Net through training U-Net on a large number of clumpy spiral galaxies.
Figure 15 shows that our U-Net can properly identify some of very weak spiral arms of the barred spiral galaxy in S3. However, three problems remain in this segmentation of this S3 model by U-Net. First, the central strong bar in these three images is misidentified as a spiral arm: intriguingly, the length and direction of the major axis of the bar appears to be well identified. Second, apparently nonspiral arm regions are classified as spiral arms in the outer part of the disk. Third, only the local high-density regions of the weak spiral arms are segmented so that the spatial distribution of the segmented arms cannot be like spiral arms. These three problems imply that it would be a difficult task for U-Net to identify very weak and wide spiral arms in barred spiral galaxies.
Currently, we do not have an accurate measure to quantify the prediction accuracy of U-Net for these nonsymmetric and irregular spiral arms with nonconstant pitch angles because we do not have an independent method for locating spiral arms precisely: making training data sets for such arms is a formidable task. In our forthcoming papers, we will (i) generate a large number of images with nonsymmetric and flocculent arms that are not well modeled in this study using both constrained and cosmological hydrodynamical simulations, and (ii) investigate a method for locating spiral arms without using U-Net to create training data sets for U-Net. If U-Net is confirmed to show very good performance even for such realistic spiral arms in our future studies, we will be able to apply it to the real observed images of spiral galaxies.
4.2. Multiwavelength science cases
If U-Net can accuracy find the precise locations of spiral arms for a large number of spiral galaxies, then new data sets would have the following significant benefits in multiwavelength studies of galaxies. First, such new data sets for spiral galaxies would enable us to investigate the (mass) fractions of GMCs that are located in arms (or inter-arm) regions of the galaxies in a statistical manner. Physical correlations between the mass fractions of GMCs in spiral arms and the mass fractions (i.e., strengths) of spiral arms in disk galaxies can be also investigated because it is straightforward to estimate the mass fractions of spiral arms from segmented spiral arms. This correlation will greatly advance our understanding of GMC formation and destruction within spiral arms. Because spatial distributions of molecular hydrogen in nearby galaxies have already been investigated with ALMA, this type of multiwavelength investigation is currently possible.
Second, star formation efficiencies in arm and inter-arm regions can be separately investigated based on the locations of spiral arms and the gas masses of neutral (and H2) hydrogen in the arms. Ongoing large HI surveys such as the WALLABY project (e.g., Koribalski et al. 2020) are currently investigating HI properties for a large number of nearby galaxies and will provide data sets for the internal distribution of HI gas in these galaxies. Accordingly, star formation rates (e.g., based on Hα distributions) and HI column densities in arm and inter-arm regions can be investigated so that the star formation efficiencies in these regions can be derived for a large number of galaxy samples. This statistical investigation will allow astronomers to discuss the key question of how spiral arms induce galaxy-scale star formation in detail.
Third, the rotation curve profiles and the mass fractions of spiral arms for a large number of disk galaxies will reveal the physical connection between the baryonic fractions of galaxies and the strengths of spiral arms. The next-generation large HI surveys will reveal the maximum circular velocities and thus the dynamical masses (including dark matter) within optical radii for a large sample of nearby galaxies. Moreover, the locations of spiral arms derived from U-Net can be used to estimate the total masses of spiral arms, thus the mass ratios of spiral arms to stellar disks. The ratios of baryonic masses to dynamical masses (i.e., the degree of self-gravitation) can affect the details of spiral structures in disk galaxies (e.g., Seigar et al. 2008). Therefore, the estimation of spiral arm mass fractions in disk galaxies observed by ongoing large HI surveys will make significant progress in understanding the formation of spiral arms, which is affected by their dynamical properties.
Finally, U-Net can be applied for segmentation tasks for gaseous spiral arms in a huge number of nearby and distant galaxies investigated by the SKA. Although identification and characterization of spiral arms in disk galaxies have been performed for optical and near-infrared images of the galaxies (e.g., Elmegreen & Elmegreen 1984; Davis & Hayes 2014; Hart et al. 2017; Mastes et al. 2019), no data base contains the physical properties of gaseous arms (e.g., numbers and shapes) for a large (> 1000) number of disk galaxies. Segmentation of spiral arm structures for HI images from SKA will provide a new radio catalog for the details of gaseous spiral arms in a huge number of galaxies. A comparative study of gaseous and stellar spiral arms based on these radio and optical catalogs of disk galaxies will significantly advance our understanding of the interplay between gaseous and stellar dynamics in the evolution of spiral arms.
5. Conclusions
We have applied U-Net to a large number of synthesized images of spiral galaxies (N ∼ 50 000) in order to assess the capability of the U-Net to accurately identify the locations of spiral arms. Because this is the first step in this series of papers on galaxy segmentation, we used disk galaxy models in which viewing angles of disks (θ and ϕ), spiral arm numbers (N), strengths (fsp), widths (wsp), and pitch angles (controlled by θmax), bulge mass fractions (fbul), presence or absence of stellar bars and rings, and image sizes (with respect to disk sizes) were quite different. In the present segmentation tasks, the spiral arms and other regions in disk galaxies were labeled 1 and 0, respectively, so that the levels of accuracy in the predicted locations of spiral arms could be well quantified by Fm, which is similar to the standard F-scores. Although the adopted models were rather idealized and less realistic in some physical properties (e.g., symmetric arms and no background stars), they enabled us to understand the advantages of the U-Net in galaxy segmentation tasks. The principal results are listed below.
(1) U-Net can accurately predict the locations of spiral arms in nonbarred disk galaxies with 1 ≤ N ≤ 8 and 0.1 < fsp < 0.9. The mean accuracy score (Fm) depends on N, but it is consistently as high as 0.98 (with 1 and 0 being fully accurate and inaccurate, respectively). U-Net can also accurately predict the locations of spiral arms in disk galaxies with different bulge-to-disk ratios (fbul < 0.5) for a given N. Thus these results strongly suggest that U-Net is quite useful in galaxy segmentation tasks for disk galaxies with different Hubble morphological types.
(2) The performance of U-Net in these segmentation tasks is very good for barred spiral galaxies with N = 2 (Fm ≈ 0.95). These results do not depend on the sizes (Rbar) and the strengths (fbar) of the stellar bars, which implies that the presence or absence of bars does not affect the prediction accuracy of U-Net in segmentation of spiral arms. Furthermore, Fm in barred and nonbarred galaxies is not different between images with different viewing angles of disk galaxies (θ < 80°). These results imply that segmentation of spiral arms and bars can be possible even for highly inclined disk galaxies.
(3) It should be stressed, however, that if U-Net is trained on galaxy images with particular ranges of N, and if galaxy images for testing have N outside the N ranges for the training, then Fm becomes slightly lower. For example, U-Net trained with images with N = 1, 2, 3, 4, and 5 can only segment spiral arms in N = 6 models with Fm = 0.934. This implies that a wide range of N should be used to train U-Net when U-Net is applied for real disk galaxies with wide ranges of spiral arm properties and if very high Fm (> 0.98) is required.
(4) Although stellar rings around bars do not affect Fm, the mass fractions of spiral arms (fsp) can significantly affect Fm for fsp < 0.1. For example, Fm can be as low as 0.8 for 0.05 < fsp < 0.1 in nonbarred disk galaxies. This is not a problem per se, but it means that disk galaxies with very weak spiral arms, such as anemic spiral arms in clusters of galaxies, would be harder to segment by U-Net. This is the most remarkable disadvantage in the segmentation of spiral arms by U-Net in this study.
(5) We applied the U-Net trained on images with symmetric spiral arms to the synthesized images of disk galaxies with nonsymmetric and irregular spiral arms from our original hydrodynamical simulations of the galaxies. U-Net cannot accurately predict the locations of the spiral arms in the simulated disk galaxies with more realistic spiral arm properties, in particular, in barred galaxies with weaker and wider spiral arms, probably because the training data sets do not include such nonsymmetric and irregular spiral arms. However, it might be intrinsically difficult for U-Net to segment such nonsymmetric spiral arms.
(6) These results suggest that it is worthwhile for our future studies to train U-Net with a larger number of more realistic galaxy images with noise, nonsymmetric spirals, and different pitch angles between different arms, etc. It might not be so straightforward to generate many pairs of these complicated images and locations of spiral arms (i.e., labels), but high-resolution hydrodynamical simulations of disk galaxies with different Hubble types might be useful for this purpose. When we can confirm that U-Net can predict the location of spiral arms for these images very accurately, then U-Net can be readily applied to real observational images of spiral galaxies. Given that ∼107 galaxy images can be processed and segmented by just one GPU machine in one day, segmentation of spiral structures in galaxies will be very useful for the analysis of a huge number of images from next-generation telescopes such as the LSST and Euclid.
Acknowledgments
I (Kenji Bekki; KB) am grateful to the referee for constructive and useful comments that improved this paper. This research was supported by the Australian government through the Australian Research Council’s Discovery Projects funding scheme (DP170102344).
References
- Athanassoula, E. 1984, Phys. Rep., 114, 319 [Google Scholar]
- Baba, J., Saitoh, T. R., & Wada, K. 2013, ApJ, 763, 46 [NASA ADS] [CrossRef] [Google Scholar]
- Bekki, K. 2013, MNRAS, 432, 2298 [NASA ADS] [CrossRef] [Google Scholar]
- Bekki, K. 2014a, MNRAS, 438, 444 [NASA ADS] [CrossRef] [Google Scholar]
- Bekki, K. 2014b, MNRAS, 444, 1615 [NASA ADS] [CrossRef] [Google Scholar]
- Bekki, K. 2015, MNRAS, 449, 1625 [NASA ADS] [CrossRef] [Google Scholar]
- Bekki, K. 2017, MNRAS, 467, 1857 [NASA ADS] [Google Scholar]
- Bekki, K. 2019, MNRAS, 485, 1924 [Google Scholar]
- Bekki, K., Diaz, J., & Stanley, N. 2019, Astron. Comput., 28, 100286 [Google Scholar]
- Boucaud, A., Huertas-Company, M., Heneka, C., et al. 2020, MNRAS, 491, 2481 [NASA ADS] [CrossRef] [Google Scholar]
- Buta, R. 2013, Secular Evolution of Galaxies, XXIII Canary Istands Winter School of Astrophysics (Cambridge: Cambridge University Press) [Google Scholar]
- Carlberg, R. G., & Freedman, W. L. 1985, ApJ, 298, 486 [NASA ADS] [CrossRef] [Google Scholar]
- Cavanagh, M. K., & Bekki, K. 2020, A&A, 641, 77 [Google Scholar]
- Chollet, F. 2015, Available at https://keras.io/ [Google Scholar]
- Danver, C.-G. 1942, Ann. Lund Obs., 10, 162 [Google Scholar]
- Davis, D. R., & Hayes, W. B. 2014, ApJ, 790, 87 [NASA ADS] [CrossRef] [Google Scholar]
- Davis, B. L., Berrier, J. C., Shields, D. W., et al. 2012, ApJS, 199, A33 [Google Scholar]
- Davis, B. L., Graham, A. W., & Seigar, M. S. 2017, MNRAS, 471, 2187 [NASA ADS] [CrossRef] [Google Scholar]
- Diaz, J. D., Bekki, K., Forbes, D. A., et al. 2019, MNRAS, 486, 4845 [CrossRef] [Google Scholar]
- Dieleman, S., Willett, K. W., & Dambre, J. 2015, MNRAS, 450, 1441 [NASA ADS] [CrossRef] [Google Scholar]
- Dobbs, C., & Baba, J. 2014, PASA, 31, 35 [Google Scholar]
- Dominguez Sanchez, H., Huertas-Company, M., Bernardi, M., Tuccillo, D., & Fischer, J. L. 2018, MNRAS, 476, 3661 [NASA ADS] [CrossRef] [Google Scholar]
- D’Onghia, E., Vogelsberger, M., & Hernquist, L. 2013, ApJ, 766, 34 [NASA ADS] [CrossRef] [Google Scholar]
- Egusa, F., Mentuch Cooper, E., Koda, J., & Baba, J. 2017, MNRAS, 465, 460 [NASA ADS] [CrossRef] [Google Scholar]
- Elmegreen, D. M. 1981, ApJS, 47, 229 [NASA ADS] [CrossRef] [Google Scholar]
- Elmegreen, D. M., & Elmegreen, B. G. 1984, ApJS, 54, 127 [NASA ADS] [CrossRef] [Google Scholar]
- Fujii, M., Baba, J., Saitoh, T. R., et al. 2011, ApJ, 730, 109 [NASA ADS] [CrossRef] [Google Scholar]
- Fujimoto, M. 1968, ApJ, 152, 391 [Google Scholar]
- Garcia-Gomez, C., Athanassoula, E., Barberà, C., et al. 2017, A&A, 601, A132 [NASA ADS] [CrossRef] [EDP Sciences] [Google Scholar]
- Grand, R. J. J., Kawata, D., & Cropper, M. 2013, A&A, 553, A77 [NASA ADS] [CrossRef] [EDP Sciences] [Google Scholar]
- Hart, R. E.,Bamford, S. P., Hayes, W. B., et al. 2017, MNRAS, 472, 2263 [Google Scholar]
- Hewitt, I. B., & Treuthardt, P. 2020, MNRAS, 493, 3854 [Google Scholar]
- Huertas-Company, M., Gravet, R., Cabrera-Vives, G., et al. 2015, ApJS, 221, A8 [Google Scholar]
- Iye, M., Tadaki, K., & Fukumoto, H. 2019, ApJ, 886, 133 [Google Scholar]
- Kendall, S., Kennicutt, R. C., Clarke, C., et al. 2008, MNRAS, 387, 1007 [Google Scholar]
- Kennicutt, R. C., Jr. 1981, AJ, 86, 1847 [NASA ADS] [CrossRef] [Google Scholar]
- Koribalski, B. S., Staveley-Smith, L., Westmeier, T., et al. 2020, Ap&SS, 365, A118 [Google Scholar]
- Lintott, C. J., Schawinski, K., Slosar, A., et al. 2008, MNRAS, 389, 1179 [NASA ADS] [CrossRef] [Google Scholar]
- Ma, J. 2001, Chin. J. Astron. Astrophys., 1, 395 [NASA ADS] [CrossRef] [Google Scholar]
- Mastes, K. L., Lintott, C. J., Hart, R. E., et al. 2019, MNRAS, 487, 1808 [NASA ADS] [CrossRef] [Google Scholar]
- Pettitt, A. R., Dobbs, C. L., Baba, J., et al. 2020, MNRAS, 498, 1159 [Google Scholar]
- Rix, H.-W., & Zaritsky, D. 1995, ApJ, 447, 82 [NASA ADS] [CrossRef] [Google Scholar]
- Roberts, W. W. 1969, AJ, 158, 123 [Google Scholar]
- Ronneberger, O., Fischer, P., & Brox, T. 2015, in Medical Image Computing and Computer-Assisted Intervention (MICCAI) (Cham: Springer), Lect. Notes Comput. Sci., 9351, 234 [Google Scholar]
- Seigar, M. S., & James, P. A. 1998, MNRAS, 299, 685 [NASA ADS] [CrossRef] [Google Scholar]
- Seigar, M. S., Barth, A. J., & Bullock, J. S. 2008, MNRAS, 389, 1911 [NASA ADS] [CrossRef] [Google Scholar]
- Sellwood, J. A. 2011, MNRAS, 410, 1637 [NASA ADS] [Google Scholar]
- Sellwood, J. A., & Carlberg, R. G. 1984, ApJ, 282, 61 [NASA ADS] [CrossRef] [Google Scholar]
- Sellwood, J. A., & Binney, J. J. 2002, MNRAS, 336, 785 [Google Scholar]
- Shah, M., Bekki, K., Vinsen, K., et al. 2019, MNRAS, 482, 4188 [Google Scholar]
- Shen, A. X., & Bekki, K. 2020, MNRAS, 497, 5090 [Google Scholar]
- Tadaki, K., Belli, S., Burkert, A., et al. 2020, ApJ, 901, 74 [Google Scholar]
- Tasker, E. J., Wadsley, J., & Pudritz, R. 2015, ApJ, 801, 33 [Google Scholar]
All Tables
All Figures
|
Fig. 1. U-Net architecture adopted in the present study. Rectangular boxes with different colors represent 2D convolutional (blue), maximum pooling (purple), up-sampling (green), and output (orange) layers. The input image (2D density map of a spiral galaxy) is processed in these layers counterclockwise along this U-shaped architecture, and the dimensions of input and output data (channel numbers, etc.) are shown within each box for each layer. The two 3 × 3 2D convolutional layers with a ReLU each are followed by a 2 × 2 maximum pooling layer, and this image processing is repeated at the left (contracting). In the right (expanding) part of U-Net, the output from a convolutional layer is concatenated with that from an up-sampling layer, and this concatenation is indicated by orange rectangles. For example, two 2D convolutional layers with 128 channels within the third block from top in the right part of U-Net are followed by an up-sampling layer, and the output of the up-sampling layer is concatenated with the output from the second convolutional layer with 64 channels within the second block from top in the left part of U-Net, and then input into the first convolutional layer with 64 channels within the second block from the top at the right. A sigmoid activation function rather than softmax is used in the final output layer in the present segmentation tasks of spiral arms. |
| In the text | |
|
Fig. 2. Two-dimensional maps of surface mass densities (Σ on logarithmic scale) of spiral galaxies projected onto the x − y plane for six different models with different N and with and without stellar bars. The 2D densities are normalized (0 ≤ Σ ≤ 1). The disk size in these galaxy images is assumed to be 17.5 kpc. |
| In the text | |
|
Fig. 3. Same as Fig. 2, but for nine snapshots of the same spiral galaxy model with N = 2 viewed from nine different angles (θ). |
| In the text | |
|
Fig. 4. 2D maps of two spiral arms in the original images (ground truth, or G; upper panel) and the predicted images of the arms from U-Net (P; lower panel) for the U1 models. These images are for θ = 0 and different ϕ. |
| In the text | |
|
Fig. 5. Same as Fig. 4, but for the two sets of best (left) and worst images (right) for which the prediction accuracy (Fm) by U-Net is highest and lowest, respectively. |
| In the text | |
|
Fig. 6. Number distributions of images for all (Fm; solid), spiral arm regions (Fm, sp; dotted), and nonspiral arm regions (Fm, nsp; dashed) for the U1 models. The normalized number (Ni) of images for each Fm bin is shown. |
| In the text | |
|
Fig. 7. Same as Fig. 6, but for all regions (Fm) in the U2 models with N = 1 (dotted black), 2 (solid blue), 3 (dotted blue), 4 (solid red), and 5 (dotted red). |
| In the text | |
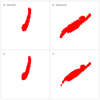 |
Fig. 8. Same as Fig. 5, but for the U2 models. |
| In the text | |
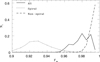 |
Fig. 9. Same as Fig. 6, but for the U2 models. |
| In the text | |
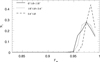 |
Fig. 10. Same as Fig. 6, but for three different θ (inclination of disks) ranges in the U2 models. |
| In the text | |
|
Fig. 11. Same as Fig. 4, but for testing images (T10) of barred spiral galaxies with N = 2. This segmentation was made by U2, which was trained on synthesized images of nonbarred galaxies. Nevertheless, the locations of segmented spirals appears to match those of the original (ground-truth) spirals well. |
| In the text | |
|
Fig. 12. Same as Fig. 6, but for 12 different testing data sets: different Rbar (T10 and T12; top left), fbul (T1 and T2; top right), wsp (T13 and T14; middle left), N (T15 and T16; middle right), ring models with different N (T17 and T18; bottom left), and different Rf (T21 and T22, bottom right). The U-Net used for these tests was trained on disk models that were not used to generate these images for testing. |
| In the text | |
|
Fig. 13. Two-dimensional density maps of the spiral galaxy model S1 for three different time steps (S1−1, S1−2, and S1−3; upper panel) and the projected distributions of the segmented spiral arms (lower panel). For clarity, the pixels that are identified as the parts of spiral arms are shown as logΣ = 1 (i.e., highest density; yellow). Other pixels are shown as logΣ = 0 (i.e., lowest density; black). |
| In the text | |
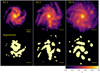 |
Fig. 14. Same as Fig. 13, but for the S2 model (S2−1, S2−2, and S2−3). |
| In the text | |
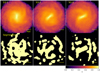 |
Fig. 15. Same as Fig. 13, but for the S3 model (S3−1, S3−2, and S3−3). |
| In the text | |
Current usage metrics show cumulative count of Article Views (full-text article views including HTML views, PDF and ePub downloads, according to the available data) and Abstracts Views on Vision4Press platform.
Data correspond to usage on the plateform after 2015. The current usage metrics is available 48-96 hours after online publication and is updated daily on week days.
Initial download of the metrics may take a while.