Fig. 12.
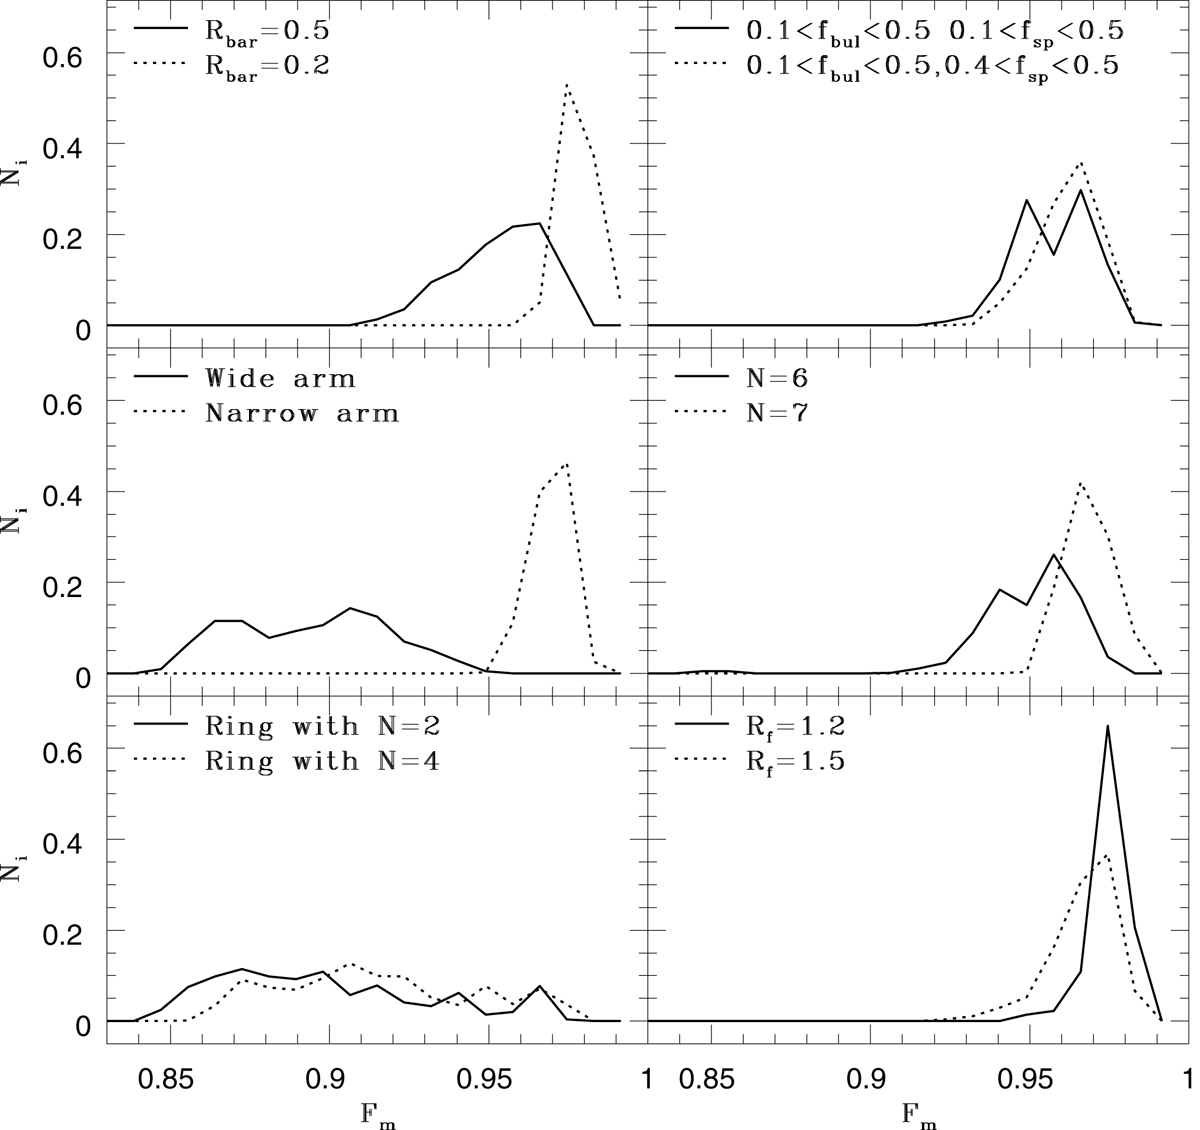
Same as Fig. 6, but for 12 different testing data sets: different Rbar (T10 and T12; top left), fbul (T1 and T2; top right), wsp (T13 and T14; middle left), N (T15 and T16; middle right), ring models with different N (T17 and T18; bottom left), and different Rf (T21 and T22, bottom right). The U-Net used for these tests was trained on disk models that were not used to generate these images for testing.
Current usage metrics show cumulative count of Article Views (full-text article views including HTML views, PDF and ePub downloads, according to the available data) and Abstracts Views on Vision4Press platform.
Data correspond to usage on the plateform after 2015. The current usage metrics is available 48-96 hours after online publication and is updated daily on week days.
Initial download of the metrics may take a while.