Fig. 1.
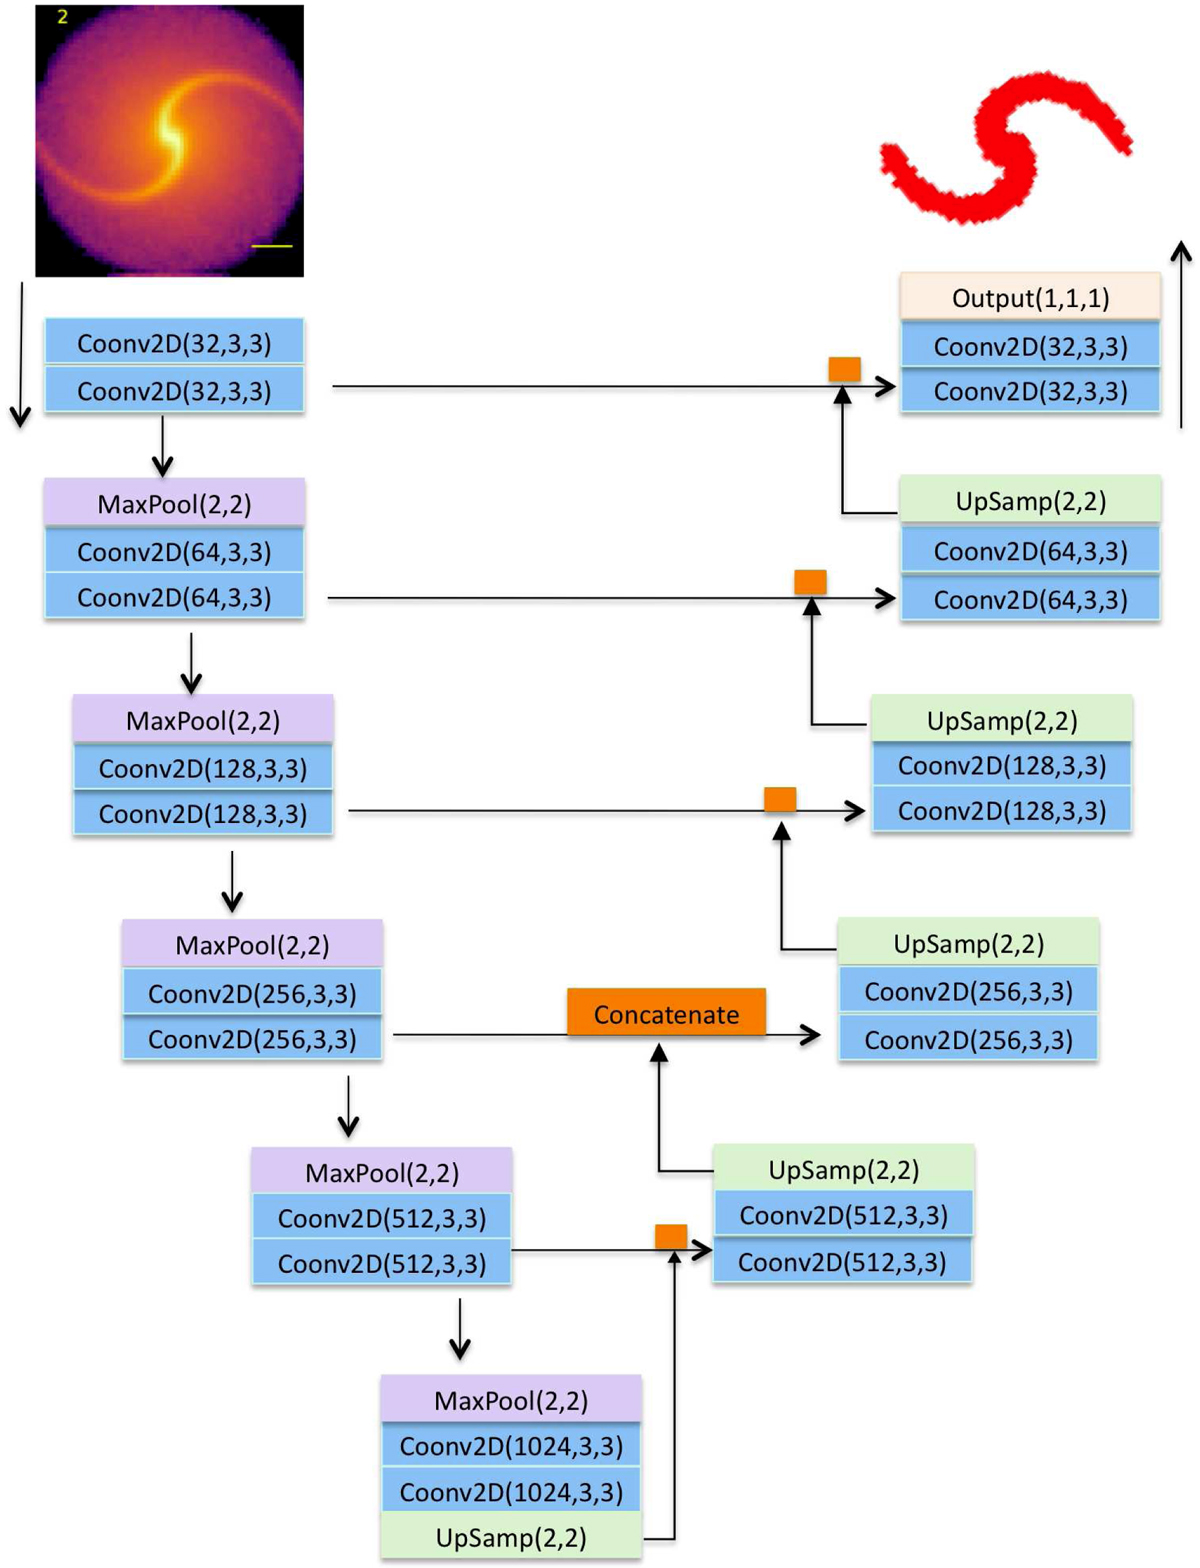
U-Net architecture adopted in the present study. Rectangular boxes with different colors represent 2D convolutional (blue), maximum pooling (purple), up-sampling (green), and output (orange) layers. The input image (2D density map of a spiral galaxy) is processed in these layers counterclockwise along this U-shaped architecture, and the dimensions of input and output data (channel numbers, etc.) are shown within each box for each layer. The two 3 × 3 2D convolutional layers with a ReLU each are followed by a 2 × 2 maximum pooling layer, and this image processing is repeated at the left (contracting). In the right (expanding) part of U-Net, the output from a convolutional layer is concatenated with that from an up-sampling layer, and this concatenation is indicated by orange rectangles. For example, two 2D convolutional layers with 128 channels within the third block from top in the right part of U-Net are followed by an up-sampling layer, and the output of the up-sampling layer is concatenated with the output from the second convolutional layer with 64 channels within the second block from top in the left part of U-Net, and then input into the first convolutional layer with 64 channels within the second block from the top at the right. A sigmoid activation function rather than softmax is used in the final output layer in the present segmentation tasks of spiral arms.
Current usage metrics show cumulative count of Article Views (full-text article views including HTML views, PDF and ePub downloads, according to the available data) and Abstracts Views on Vision4Press platform.
Data correspond to usage on the plateform after 2015. The current usage metrics is available 48-96 hours after online publication and is updated daily on week days.
Initial download of the metrics may take a while.