Fig. 8
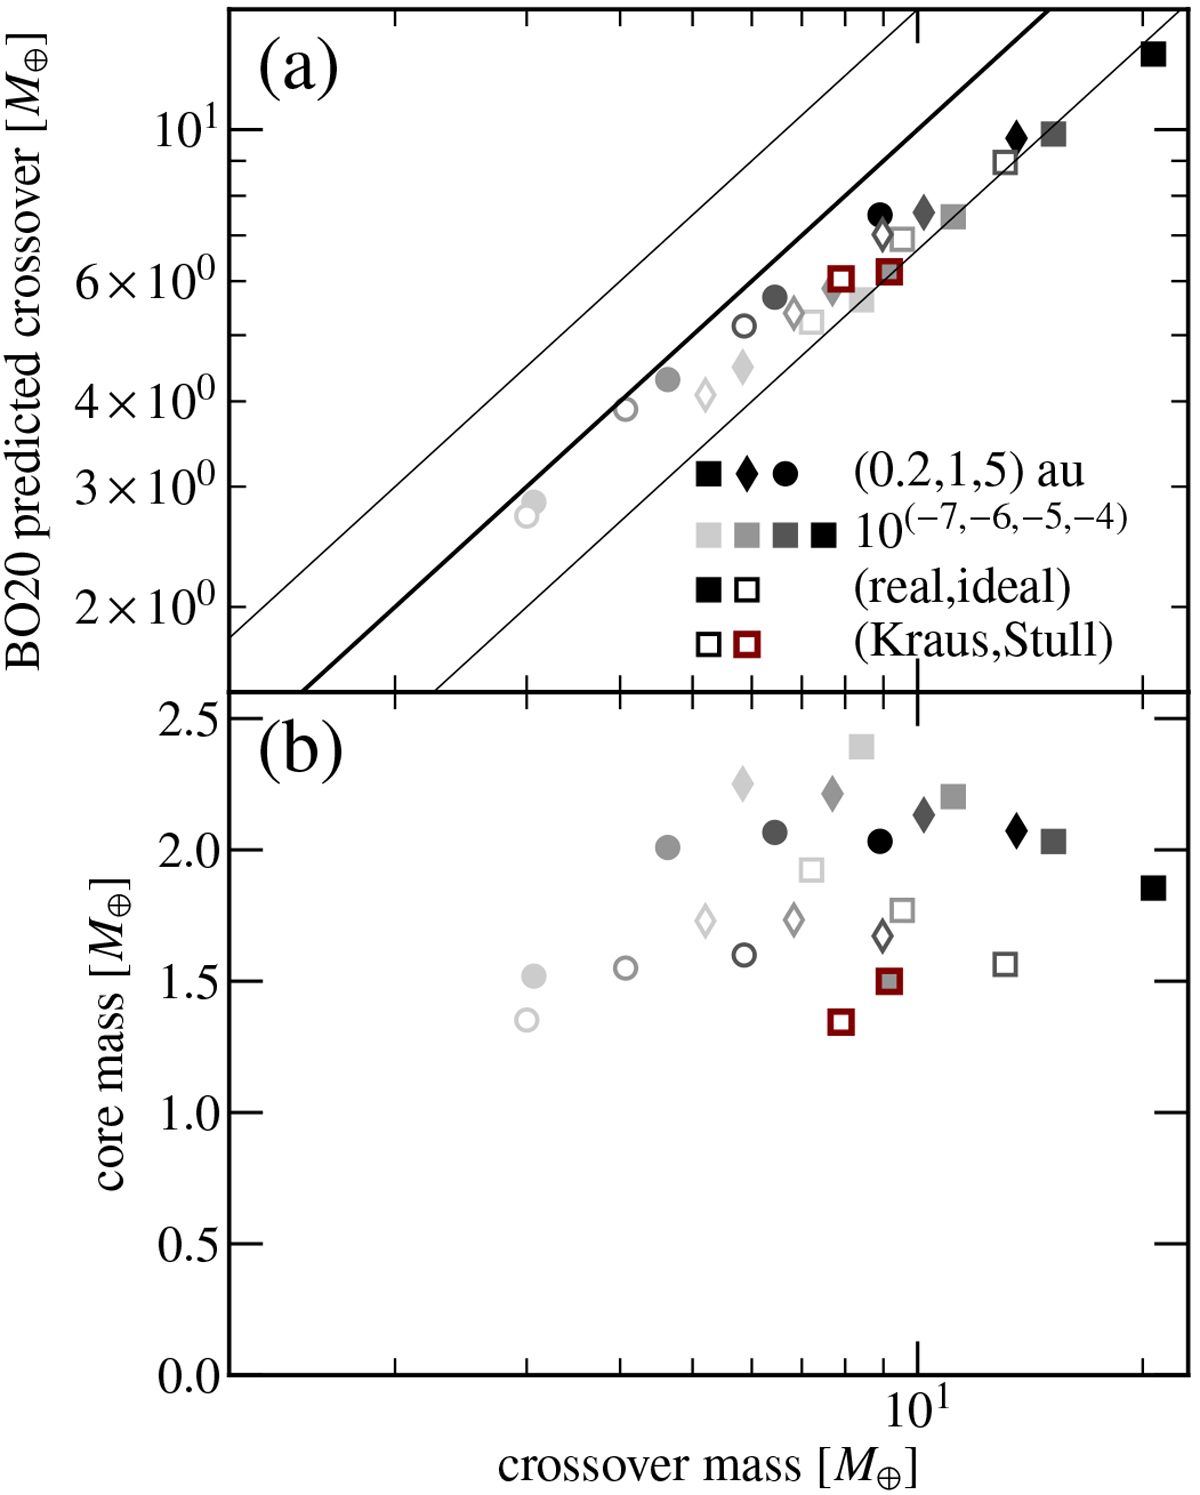
(a) Analytically predicted (Paper II) vs. numerically-obtained crossover mass for simulations at different distances (symbols), pebble accretion rates (symbol color), and EoS (filling). The thick diagonal line indicates a perfect match (predicted=numerical) while the thin lines indicated a 50% offset. (b) Corresponding core masses. Square symbols with a brown edge color employ the Stull (1947) LV-curve.
Current usage metrics show cumulative count of Article Views (full-text article views including HTML views, PDF and ePub downloads, according to the available data) and Abstracts Views on Vision4Press platform.
Data correspond to usage on the plateform after 2015. The current usage metrics is available 48-96 hours after online publication and is updated daily on week days.
Initial download of the metrics may take a while.