Fig. 7
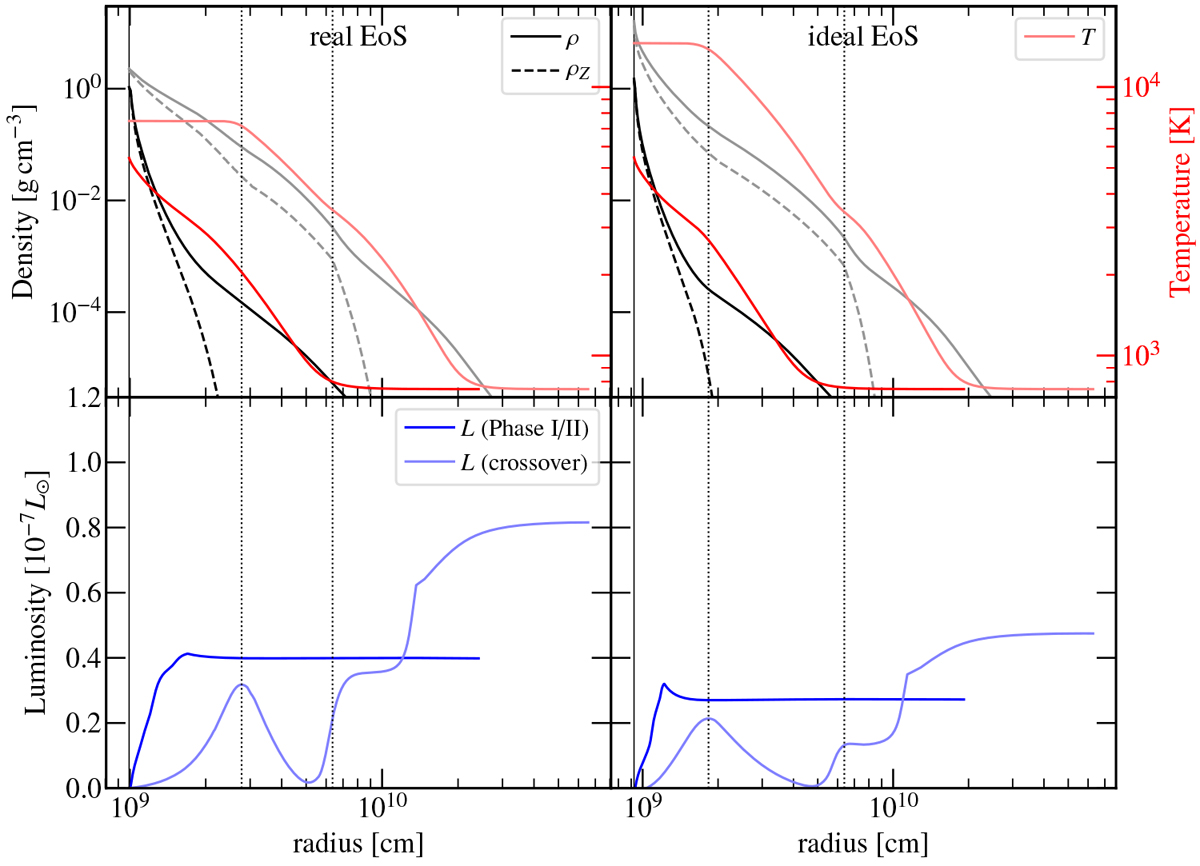
Profiles of density, temperature, and luminosity for the simulation with the real EoS (left panels) and the ideal EoS (right panels). Parameters as in Fig. 6. Profiles are plotted just after Phase II is reached (bright curves) and after crossover (dim curves). For the state at crossover, the vertical dotted line indicates the dividing line between the isothermal region 2b, the mixed region 2a, and the saturated region 1.
Current usage metrics show cumulative count of Article Views (full-text article views including HTML views, PDF and ePub downloads, according to the available data) and Abstracts Views on Vision4Press platform.
Data correspond to usage on the plateform after 2015. The current usage metrics is available 48-96 hours after online publication and is updated daily on week days.
Initial download of the metrics may take a while.