Fig. 6
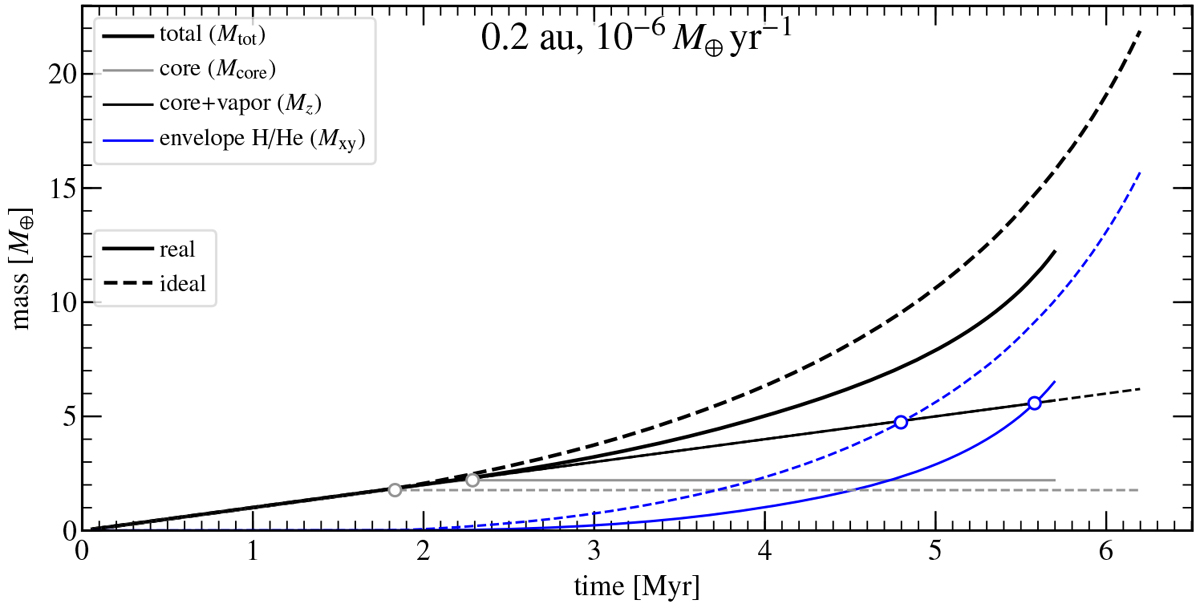
Comparison of time-evolution between the real EoS (solid lines) and ideal EoS (dashed) standard model run (0.2 au, Ṁpeb = 10−6 M⊕ yr−1, no opacity from pebbles). The masses (total, core, metal, and H+He) are plotted on the y-axis as function of time. The points where the core mass is fixed (evolution to Phase II) are indicated by the open gray circle, while the points of crossover are indicated by the blue circles.
Current usage metrics show cumulative count of Article Views (full-text article views including HTML views, PDF and ePub downloads, according to the available data) and Abstracts Views on Vision4Press platform.
Data correspond to usage on the plateform after 2015. The current usage metrics is available 48-96 hours after online publication and is updated daily on week days.
Initial download of the metrics may take a while.