Fig. 5
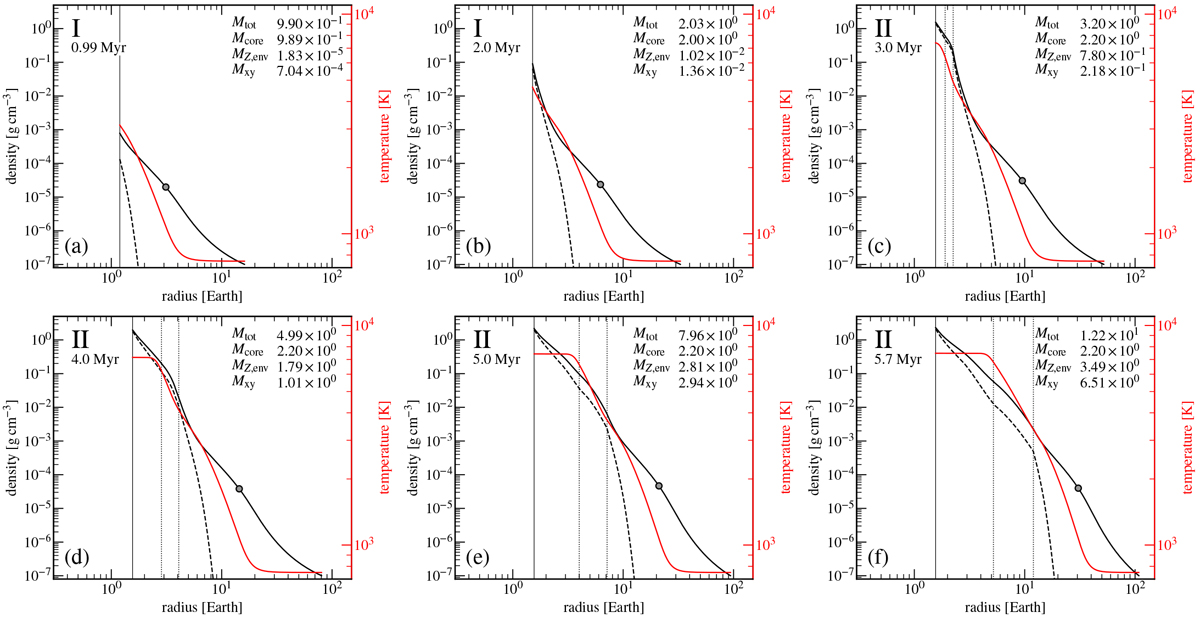
Evolution of envelope profiles of temperature (red), total density (solid black), and vapor density (dashed solid) for the standard model (0.2 au, Ṁpeb = 10−6 M⊕ yr, FEOS with Kraus LV-curve, molecular opacities). The CEB is indicated by the vertical solid line, while the vertical dotted linesdenote the boundaries between the frozen zone (region 2b), the well-mixed region 2a, and the saturated region 1. These boundaries expand with time, creating a gradient in the composition. The radiative–convective boundary is indicated by the gray dot. The rate of gas accretion accelerates toward the end, as the crossover mass is reached. The temporal evolution is available as an online movie.
Current usage metrics show cumulative count of Article Views (full-text article views including HTML views, PDF and ePub downloads, according to the available data) and Abstracts Views on Vision4Press platform.
Data correspond to usage on the plateform after 2015. The current usage metrics is available 48-96 hours after online publication and is updated daily on week days.
Initial download of the metrics may take a while.