Fig. 13
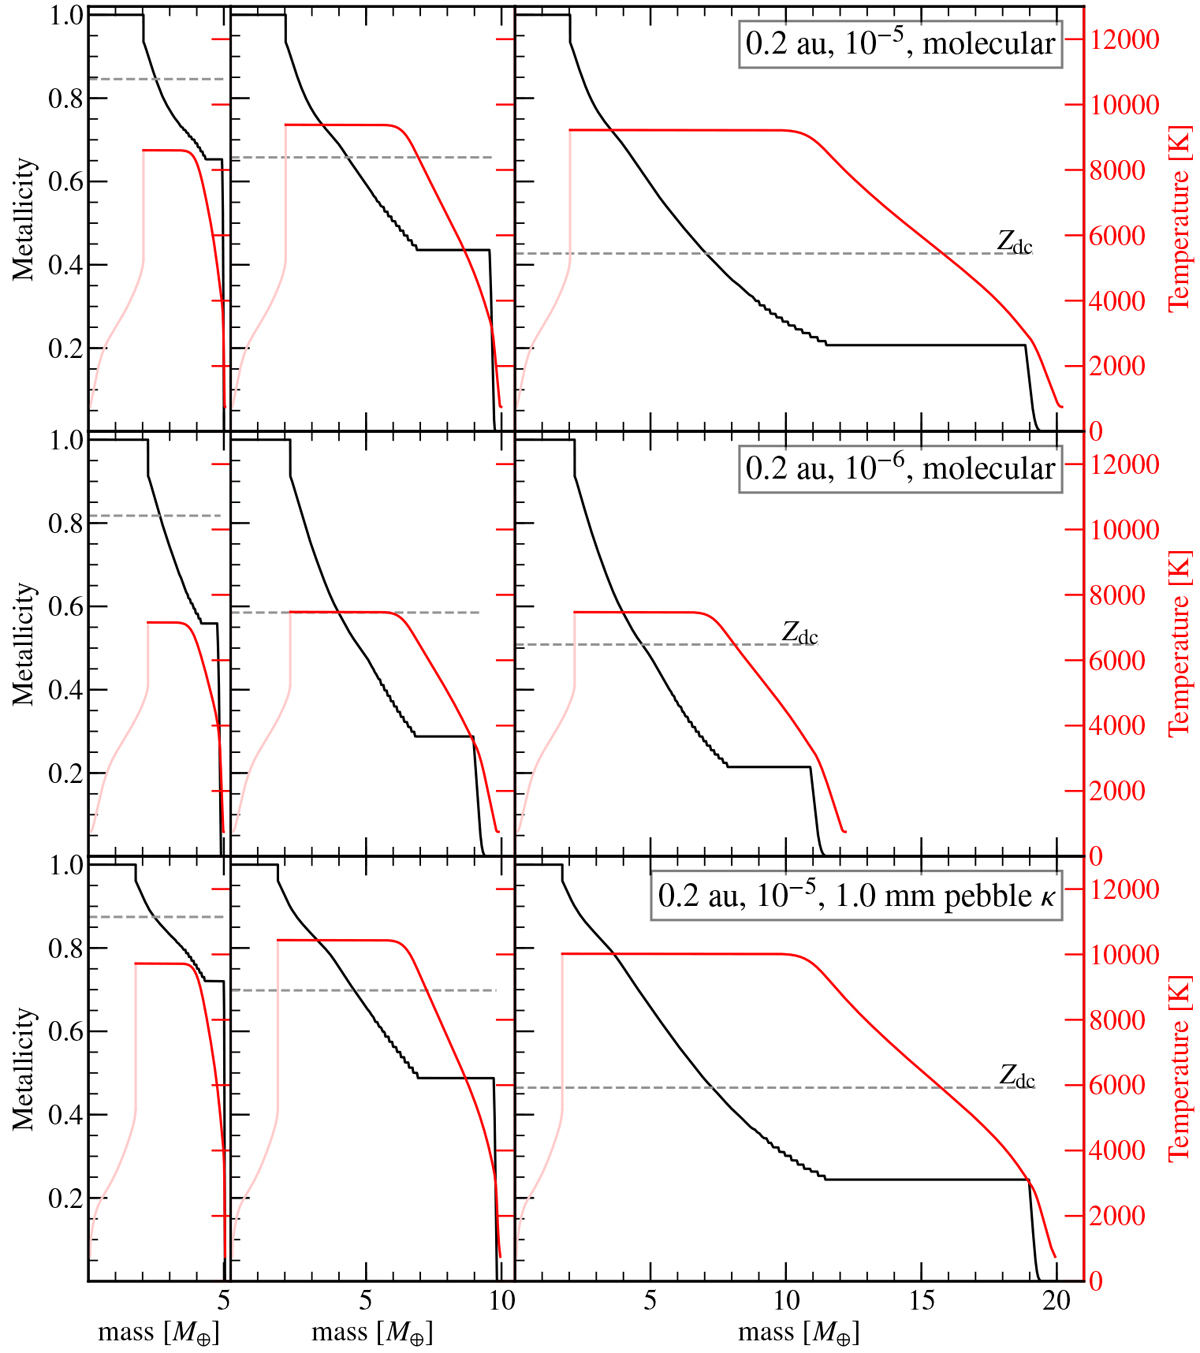
Metallicity and temperature profiles for several runs at 0.2 au: with an accretion rate of Ṁpeb = 10−5 M⊕ yr−1 (top); a lower accretion rate of Ṁpeb = 10−6 M⊕ yr−1 (center); and a pebble opacity corresponding to mm-sized pebbles (bottom). Profiles are shown when M = 5, 10, and 20 M⊕ are reached (unless crossover is reached sooner). The value of the diluted core Zdc – defined as the average over the region where Z > 0.05 – is also indicated. The temperature in the classical core region, which is not modeled, indicates the temperature at the CEB when the material was incorporated.
Current usage metrics show cumulative count of Article Views (full-text article views including HTML views, PDF and ePub downloads, according to the available data) and Abstracts Views on Vision4Press platform.
Data correspond to usage on the plateform after 2015. The current usage metrics is available 48-96 hours after online publication and is updated daily on week days.
Initial download of the metrics may take a while.