Fig. 12
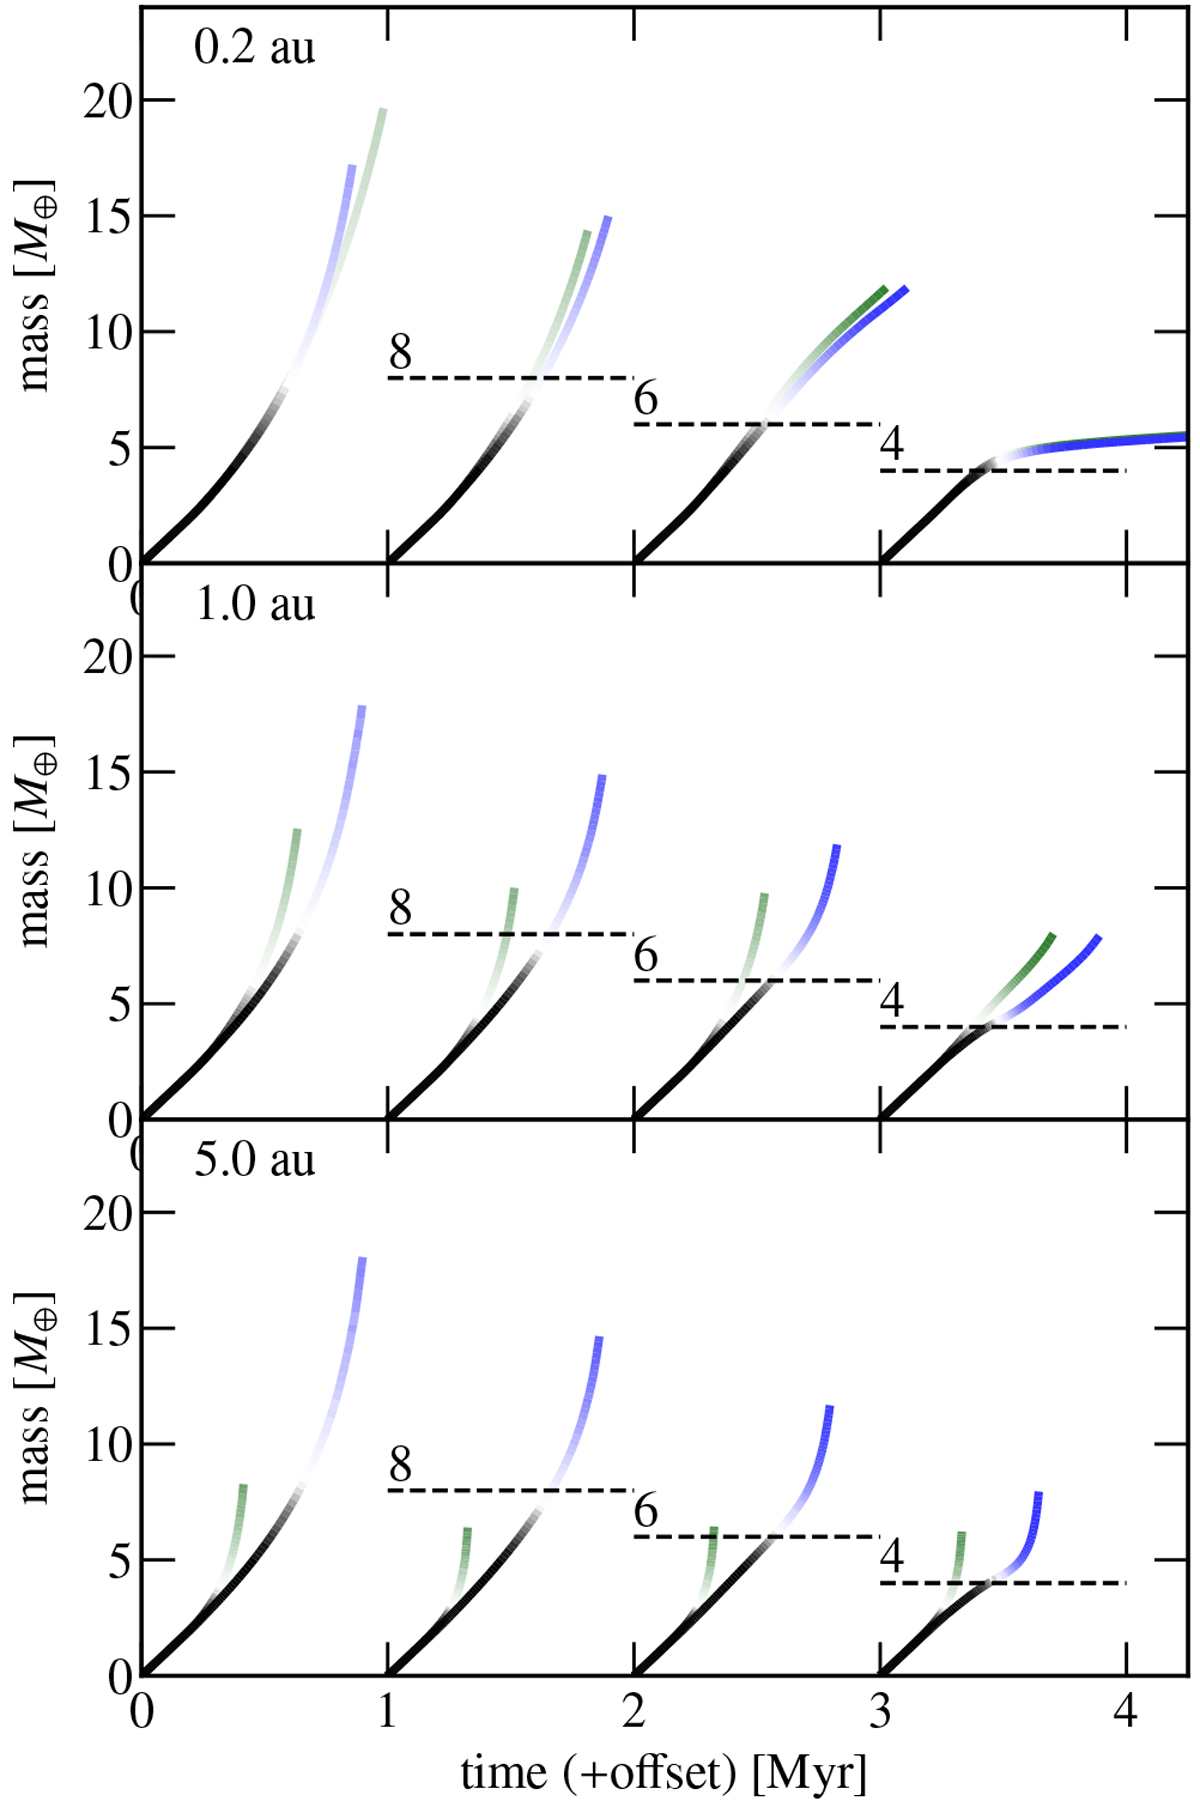
Simulations where the total mass of accreted pebbles is limited to (from left to right): MZ,final = ∞ (unlimited; left), 8, 6, and, 4 M⊕ (right). Plotted is the total planet mass against time. Simulations terminate at crossover. Blue curves correspond to runs with additional opacity from mm-sized pebbles (the pebble opacity vanishes along with pebble influx). Green curves correspond to runs with only molecular opacities. The color indicates the nature of the accretion material, ranging from dominated by pebbles (black) to being dominated by nebular gas (blue or green).
Current usage metrics show cumulative count of Article Views (full-text article views including HTML views, PDF and ePub downloads, according to the available data) and Abstracts Views on Vision4Press platform.
Data correspond to usage on the plateform after 2015. The current usage metrics is available 48-96 hours after online publication and is updated daily on week days.
Initial download of the metrics may take a while.