Fig. 9.
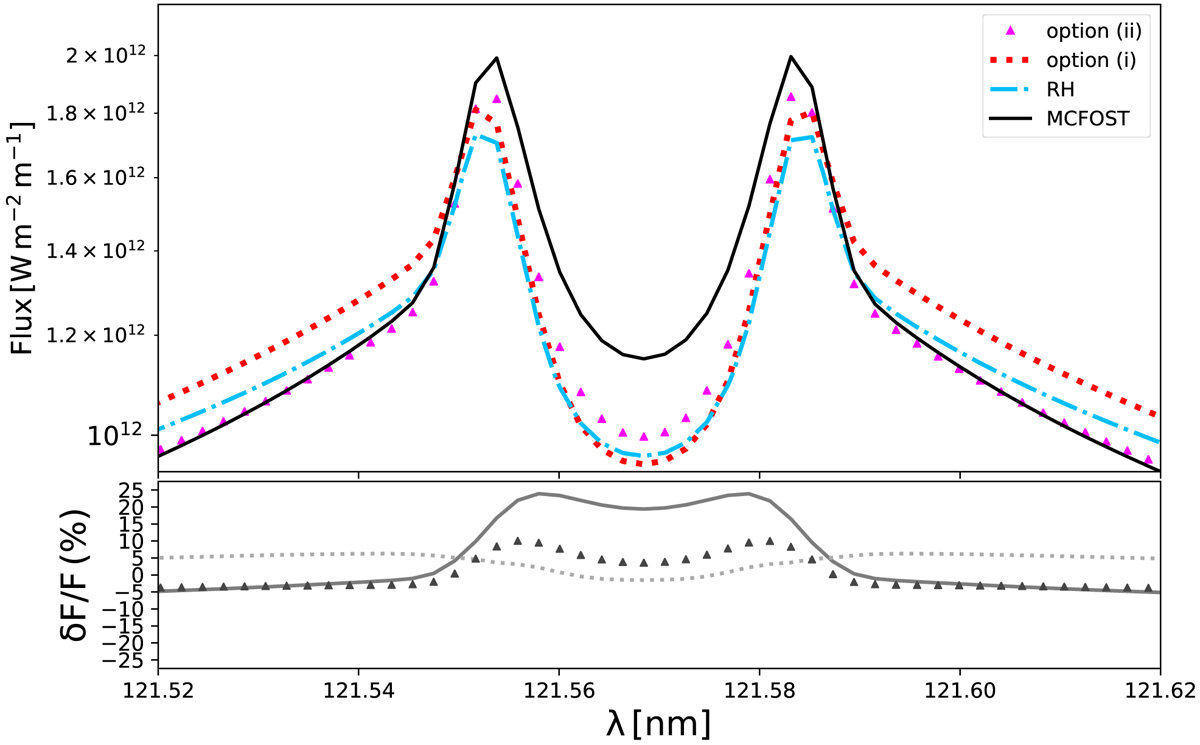
Evolution of Lyα flux with angular quadrature methods. The black and cyan lines are the flux computed by MCFOST and RH, respectively, from Fig. 8a. The dotted red line and the pink triangles are the flux computed using option (i) and (ii) of Sect. 3.8, respectively. The bottom panel shows the discrepancy between RH and MCFOST, from Fig. 8a (dark grey line), option (i) (light grey dotted line), and option (ii) (grey triangles).
Current usage metrics show cumulative count of Article Views (full-text article views including HTML views, PDF and ePub downloads, according to the available data) and Abstracts Views on Vision4Press platform.
Data correspond to usage on the plateform after 2015. The current usage metrics is available 48-96 hours after online publication and is updated daily on week days.
Initial download of the metrics may take a while.