Fig. 2.
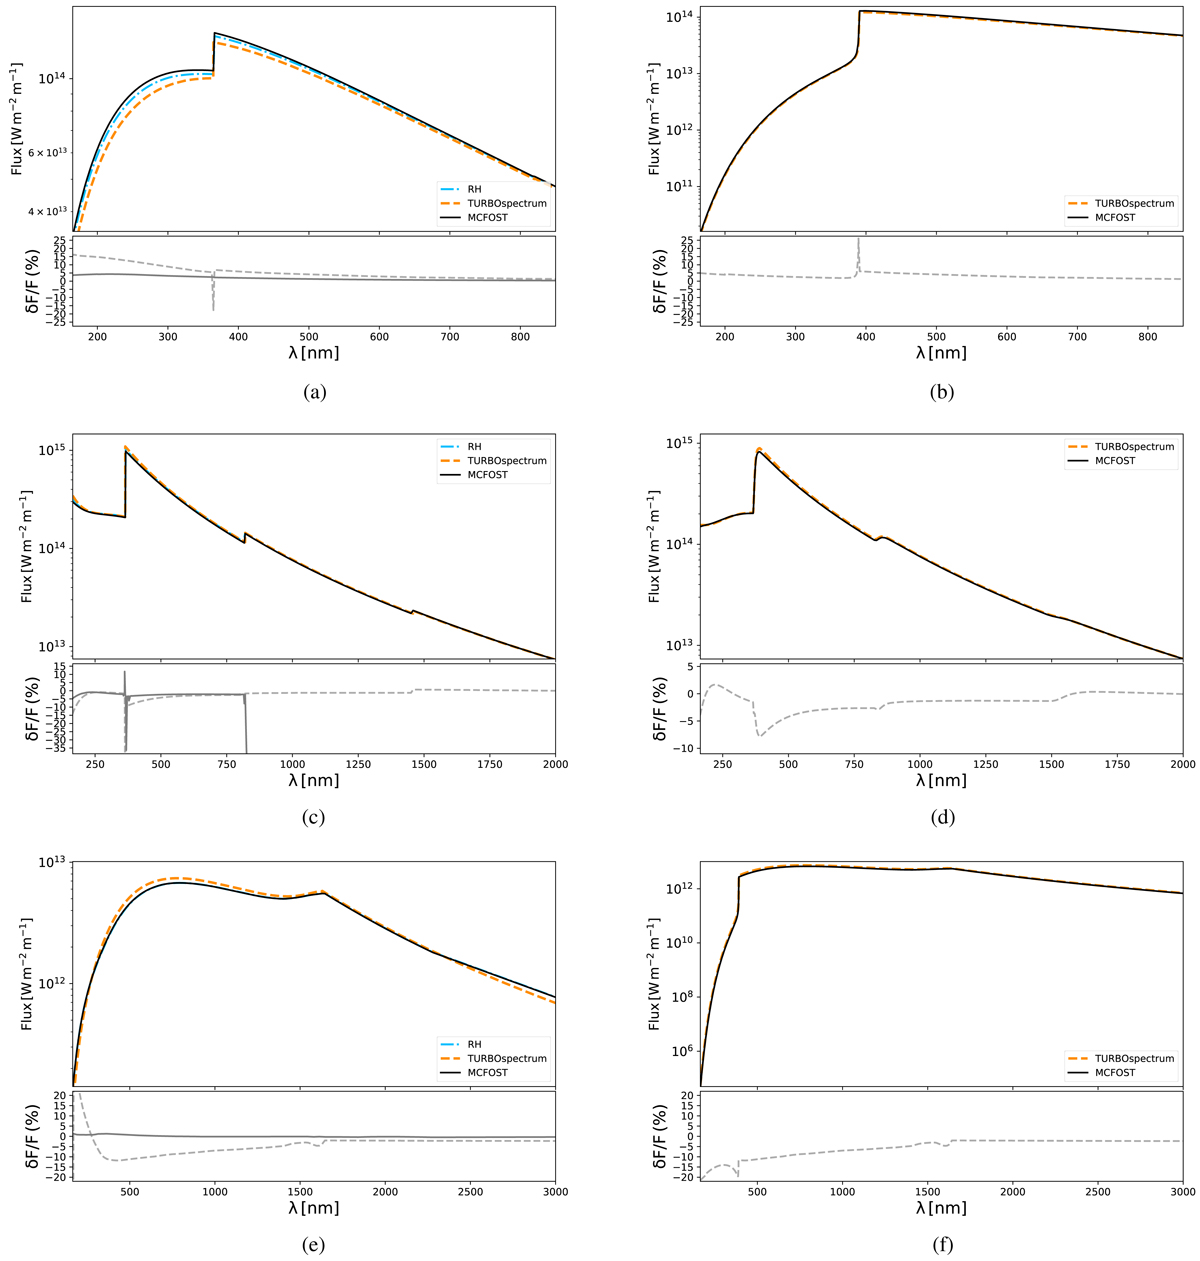
Continuum flux as a function of wavelengths for the photospheric models without (left panels) and with (right panels) level dissolution. In each panel, the upper window shows the flux from RH, TURBOspectrum, and MCFOST in cyan (thin line), orange (dashed), and black (thick line), respectively. The lower window shows the difference between RH and MCFOST (thick dark grey lines), and between TURBOspectrum and MCFOST (dashed light grey lines). As RH does not include level dissolution, it is not shown in the right figures. In Fig. 2c, the continuum flux computed by RH stops at about 800 nm, leading to incorrect evaluation of the error at this edge point. (a) Solar photosphere without level dissolution. (b) Solar photosphere with level dissolution. (c) s8000 model without level dissolution. (d) s8000 model with level dissolution. (e) s3500 model without level dissolution. (f) s3500 model with level dissolution.
Current usage metrics show cumulative count of Article Views (full-text article views including HTML views, PDF and ePub downloads, according to the available data) and Abstracts Views on Vision4Press platform.
Data correspond to usage on the plateform after 2015. The current usage metrics is available 48-96 hours after online publication and is updated daily on week days.
Initial download of the metrics may take a while.