Open Access
Fig. 1.
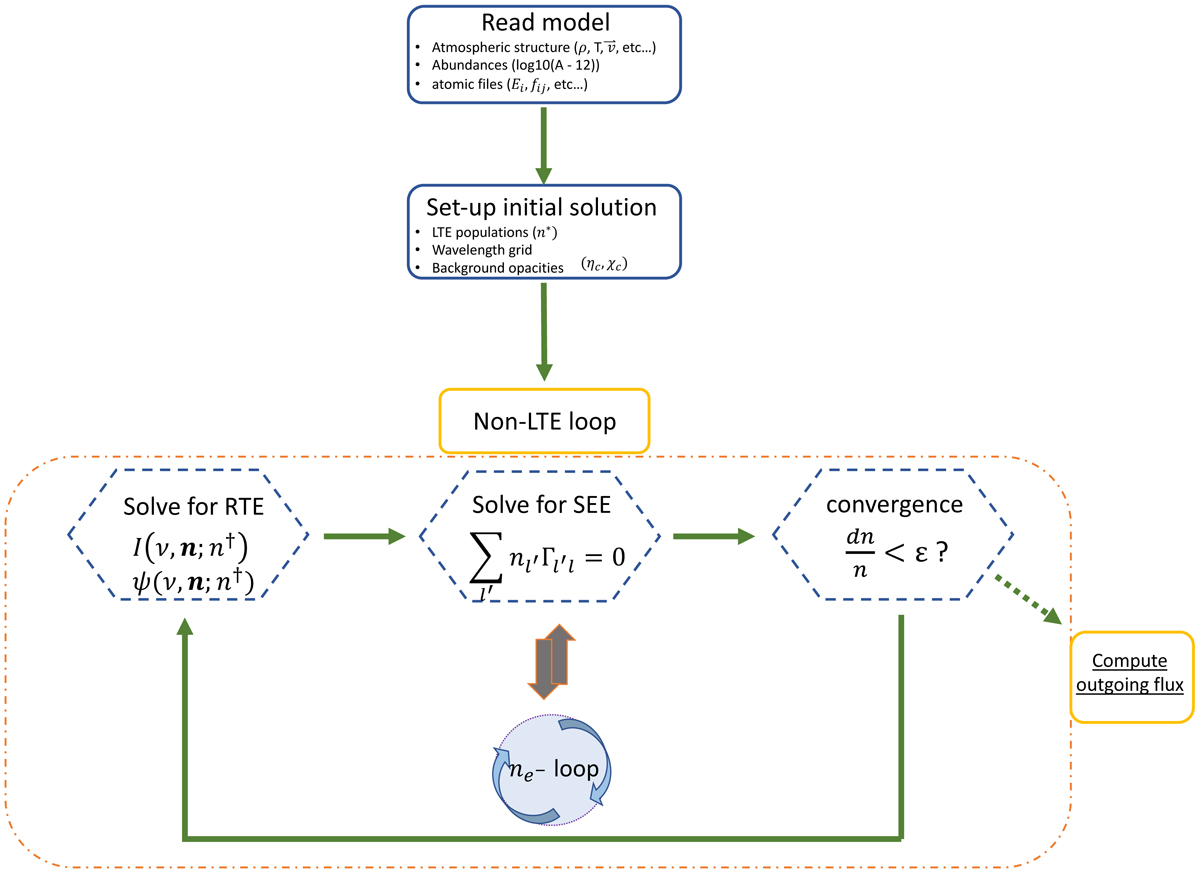
Flow chart of MCFOST-art. See Sect. 3.5 for more details. The green arrows indicate the main iterative loop. The double grey arrow indicates that the electron density loop is iterated within the main iterative loop and with the current estimates of the non-LTE populations.
Current usage metrics show cumulative count of Article Views (full-text article views including HTML views, PDF and ePub downloads, according to the available data) and Abstracts Views on Vision4Press platform.
Data correspond to usage on the plateform after 2015. The current usage metrics is available 48-96 hours after online publication and is updated daily on week days.
Initial download of the metrics may take a while.