Fig. 3
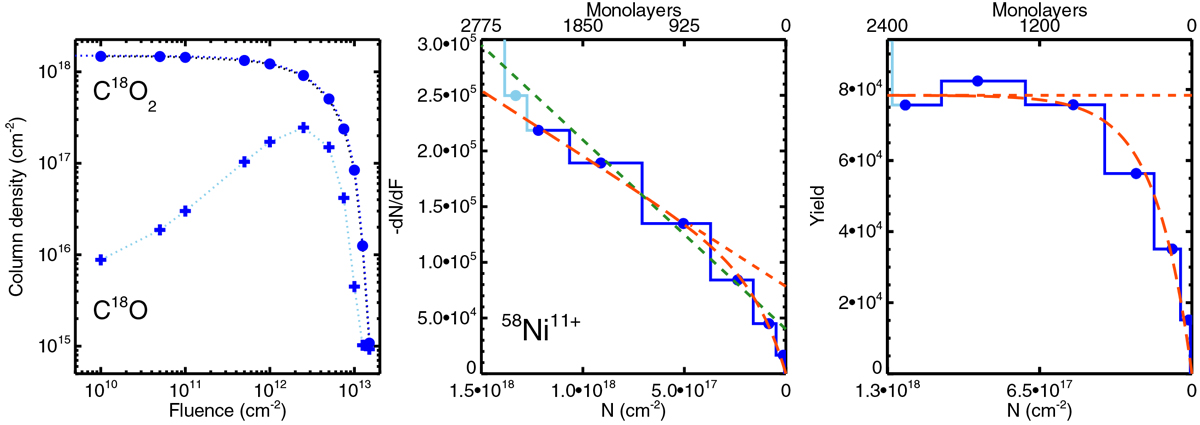
Left panel: C18O2 ice experimental column densities for ion irradiation experiment (beam of 58Ni11+ at 46 MeV) discussed in Seperuelo Duarte et al. (2009). Middle panel: −dN∕dF calculated from the recorded data. The blue circles represent the data used in the fit, whereas the sky blue points are discarded as they represent the phase transition of the ice observed at the early irradiation stage (low fluence). The long, dashed orange line corresponds to the best-fit models using Eq. (1), and the dashed orange line to what would be expected from thick film behaviour. The dotted green line represents the fit using previously determined values from Seperuelo Duarte et al. (2009). Right panel: sputtering yield evolution and fitted contribution as a function of column density.
Current usage metrics show cumulative count of Article Views (full-text article views including HTML views, PDF and ePub downloads, according to the available data) and Abstracts Views on Vision4Press platform.
Data correspond to usage on the plateform after 2015. The current usage metrics is available 48-96 hours after online publication and is updated daily on week days.
Initial download of the metrics may take a while.