Fig. 5.
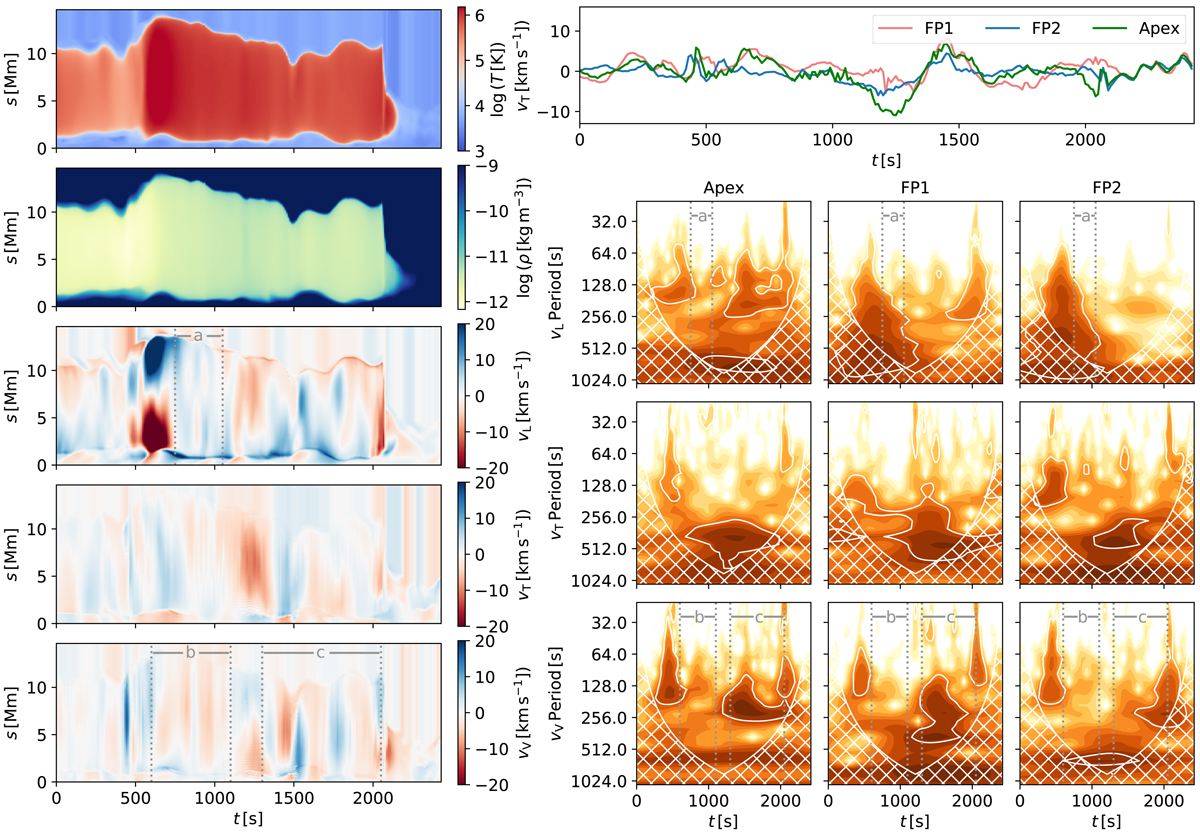
Left: evolution of temperature, density and three velocity components vL, vT and vV along the field line F1. The x axis corresponds to time and the y axis corresponds to the position along the field line. Vertical dotted lines mark segments with oscillatory behaviour. Top right: evolution of the transverse component of the velocity vT at the footpoints FP1 and FP2 (red and blue respectively) 1 Mm above the transition region and at the fieldline apex halfway between the two footpoints (green). Bottom right: wavelet spectra for the three velocity components taken at the apex of the field line and at the footpoints FP1 and FP2. Dark colour corresponds to high power. The hatched region corresponds to the area outside of the cone of influence. White lines correspond to 95% significance contours.
Current usage metrics show cumulative count of Article Views (full-text article views including HTML views, PDF and ePub downloads, according to the available data) and Abstracts Views on Vision4Press platform.
Data correspond to usage on the plateform after 2015. The current usage metrics is available 48-96 hours after online publication and is updated daily on week days.
Initial download of the metrics may take a while.