Fig. 2.
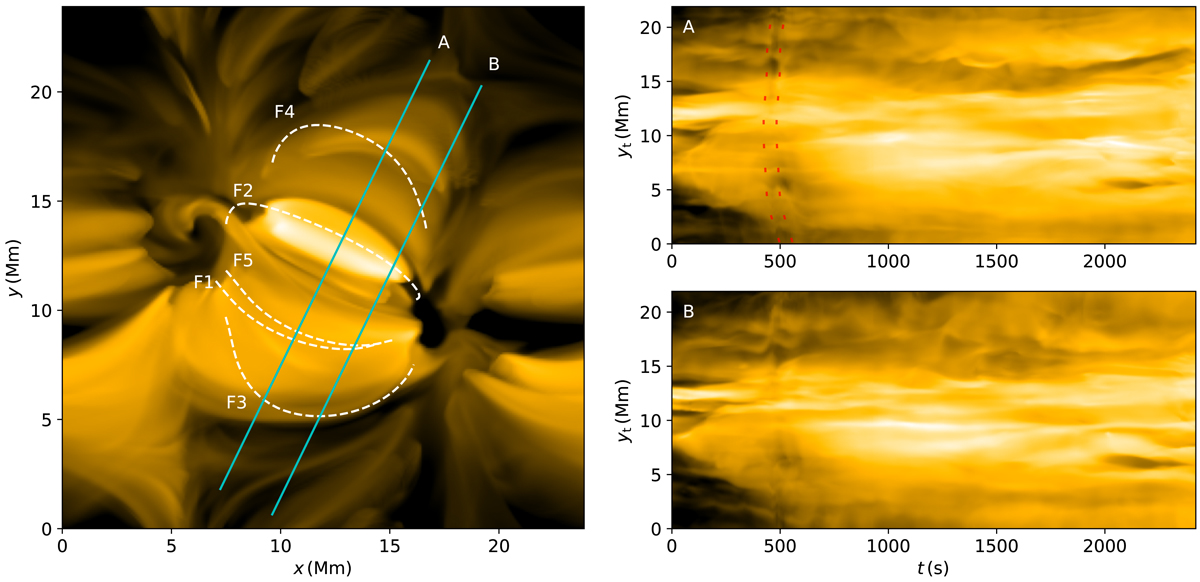
Left: forward-modelled emission in the SDO/AIA 171 Å channel at t = 180 s. Dashed lines outline projected positions of the studied field lines F1−F5. Right: time–distance plots showing temporal evolution along the slits shown in blue. The vertical axis corresponds to the distance along the slit. Several oscillating structures are visible in the time–distance plots. The dashed contour in plot A outlines a propagating disturbance. An animation of this figure is available online.
Current usage metrics show cumulative count of Article Views (full-text article views including HTML views, PDF and ePub downloads, according to the available data) and Abstracts Views on Vision4Press platform.
Data correspond to usage on the plateform after 2015. The current usage metrics is available 48-96 hours after online publication and is updated daily on week days.
Initial download of the metrics may take a while.