Fig. 11.
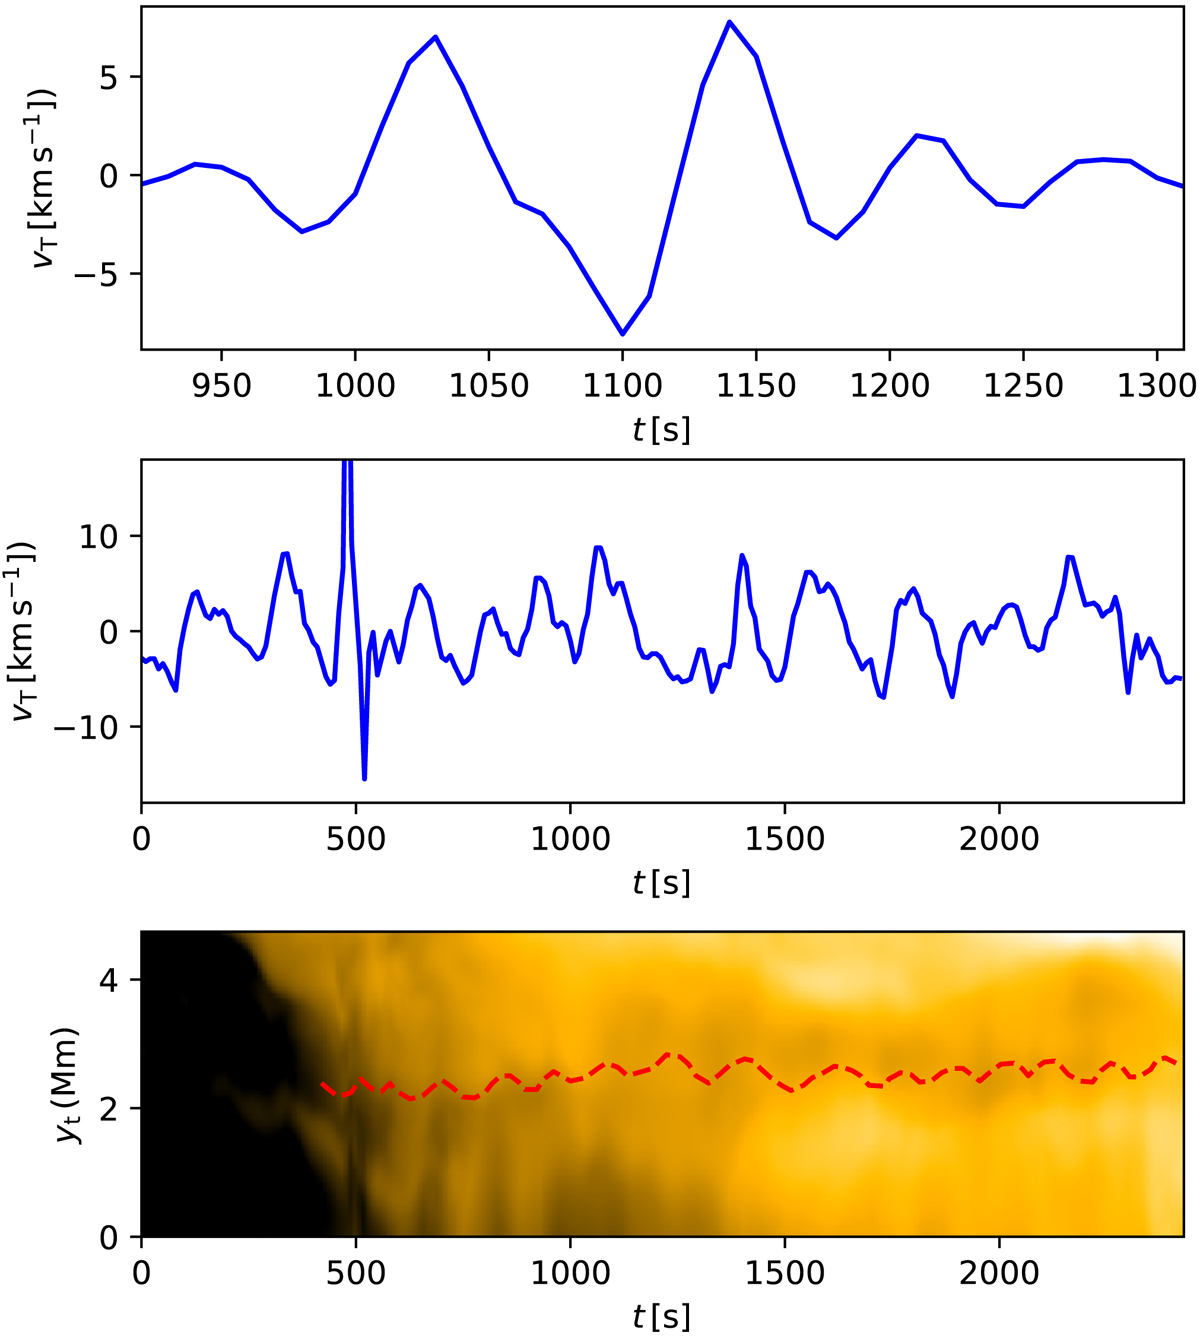
Top: evolution of the vT component (blue) at the apex of loop F2 showing a damped oscillation following an event possibly associated with an impulsive temperature increase. A large-scale trend was removed from the vT time-series by fitting and subtracting a second-degree polynomial. Middle: evolution of the vT component at the apex of loop F3 showing a sustained oscillation. Bottom: sustained oscillation in the time–distance plot of forward-modelled SDO/AIA 171 Å emission.
Current usage metrics show cumulative count of Article Views (full-text article views including HTML views, PDF and ePub downloads, according to the available data) and Abstracts Views on Vision4Press platform.
Data correspond to usage on the plateform after 2015. The current usage metrics is available 48-96 hours after online publication and is updated daily on week days.
Initial download of the metrics may take a while.