Free Access
Fig. 9
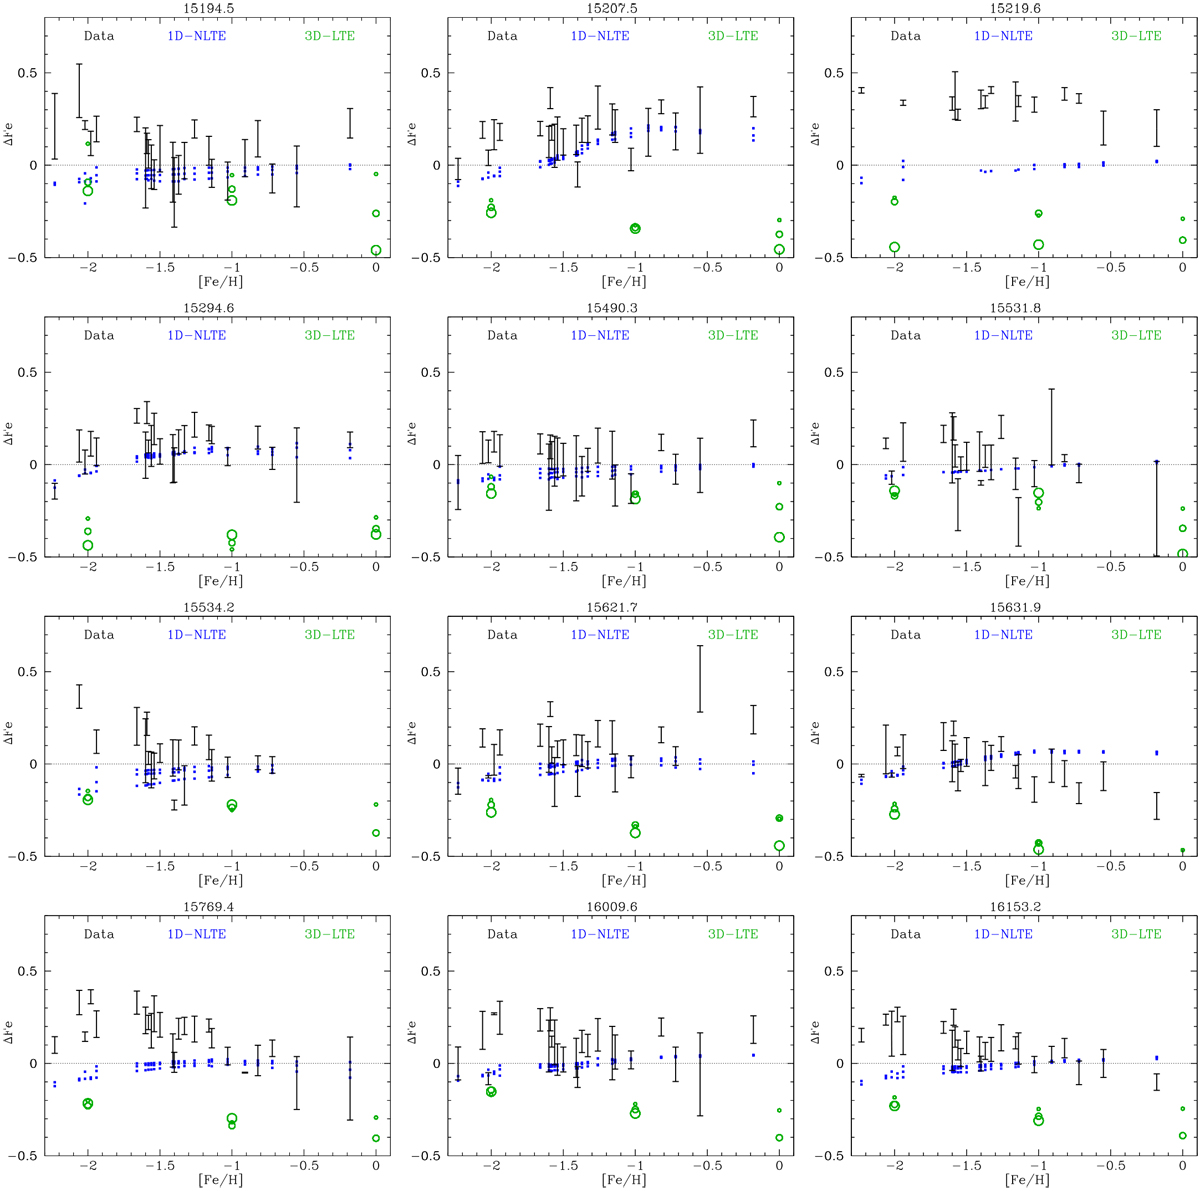
Difference of abundance of Fe lines obtained from individual lines with the literature metallicity of the cluster (black errorbars). The green circles show the prediction of the 3D–LTE models correction and blue squares indicate 1D–NLTE corrections from Kovalev et al. (2018).
Current usage metrics show cumulative count of Article Views (full-text article views including HTML views, PDF and ePub downloads, according to the available data) and Abstracts Views on Vision4Press platform.
Data correspond to usage on the plateform after 2015. The current usage metrics is available 48-96 hours after online publication and is updated daily on week days.
Initial download of the metrics may take a while.