Fig. 8
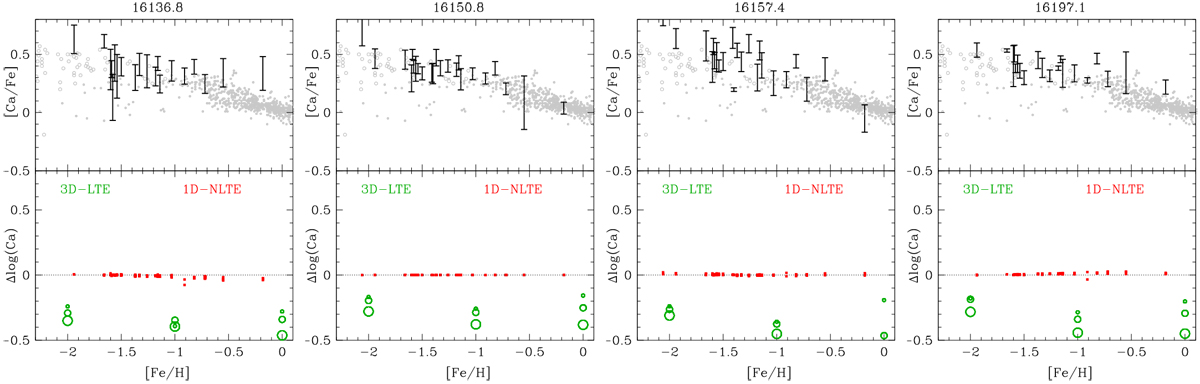
Upper panels: abundances obtained for individual Ca lines. The black error bars show the star-to-star median of the 1D–LTE analysis of the APOGEE data. The grey open circles and grey dots are literature data from respectively Roederer et al. (2014) and Bensby et al. (2014) from optical dwarf spectra. Bottom panels: corrections obtained with the 1D–NLTE models from this work (red squares) with the 3D–LTE models of Ludwig et al. (in prep.; green circles).
Current usage metrics show cumulative count of Article Views (full-text article views including HTML views, PDF and ePub downloads, according to the available data) and Abstracts Views on Vision4Press platform.
Data correspond to usage on the plateform after 2015. The current usage metrics is available 48-96 hours after online publication and is updated daily on week days.
Initial download of the metrics may take a while.