Fig. 6
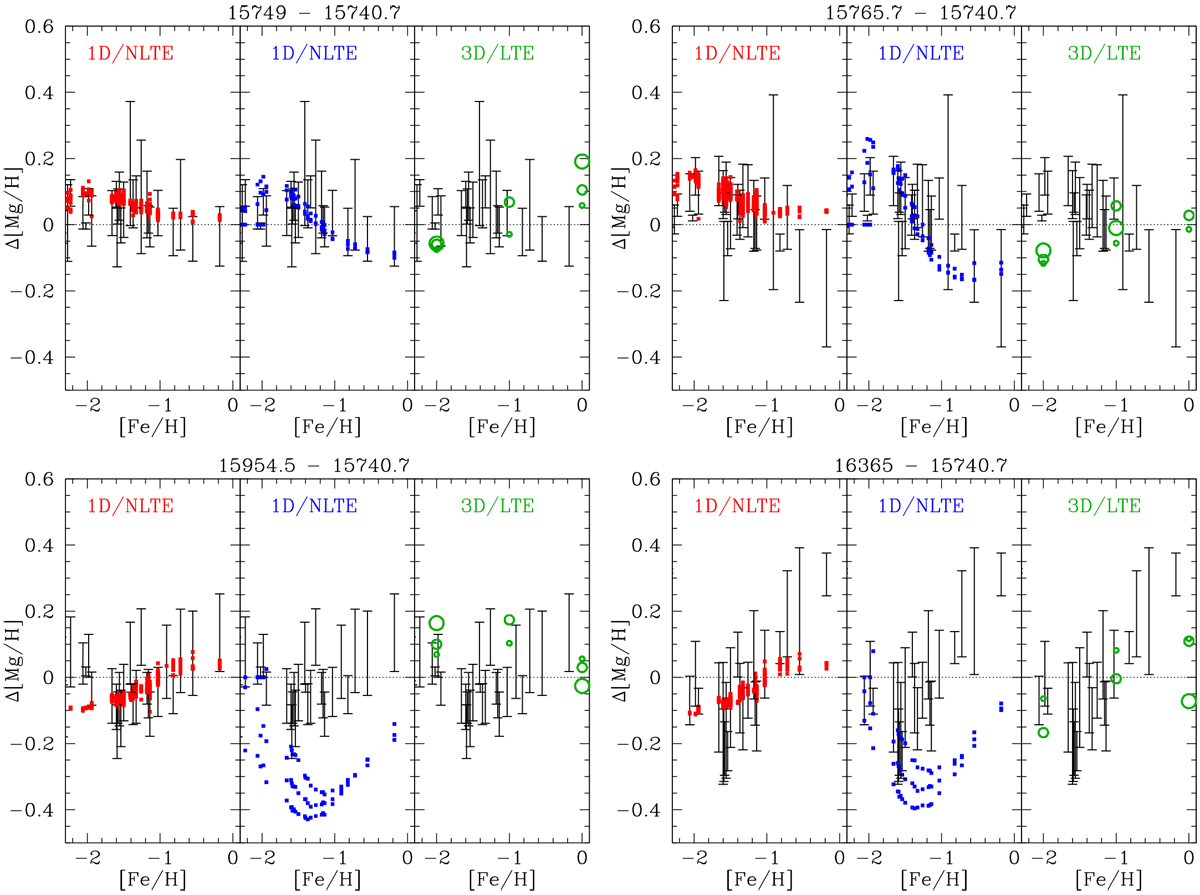
Differences in abundance obtained between two Mg lines. The black error bars show the star-to-star median of the 1D–LTE analysis of the APOGEE data. The red squares in the left panels show the prediction obtained with the 1D–NLTE models from this work. The blue squares in the middle panels show the prediction obtained with the 1D–NLTE models of Kovalev et al. (2018). The green circles in the right panels show the prediction obtained by the 3D–LTE models of Ludwig et al. (in prep.).
Current usage metrics show cumulative count of Article Views (full-text article views including HTML views, PDF and ePub downloads, according to the available data) and Abstracts Views on Vision4Press platform.
Data correspond to usage on the plateform after 2015. The current usage metrics is available 48-96 hours after online publication and is updated daily on week days.
Initial download of the metrics may take a while.