Fig. 5
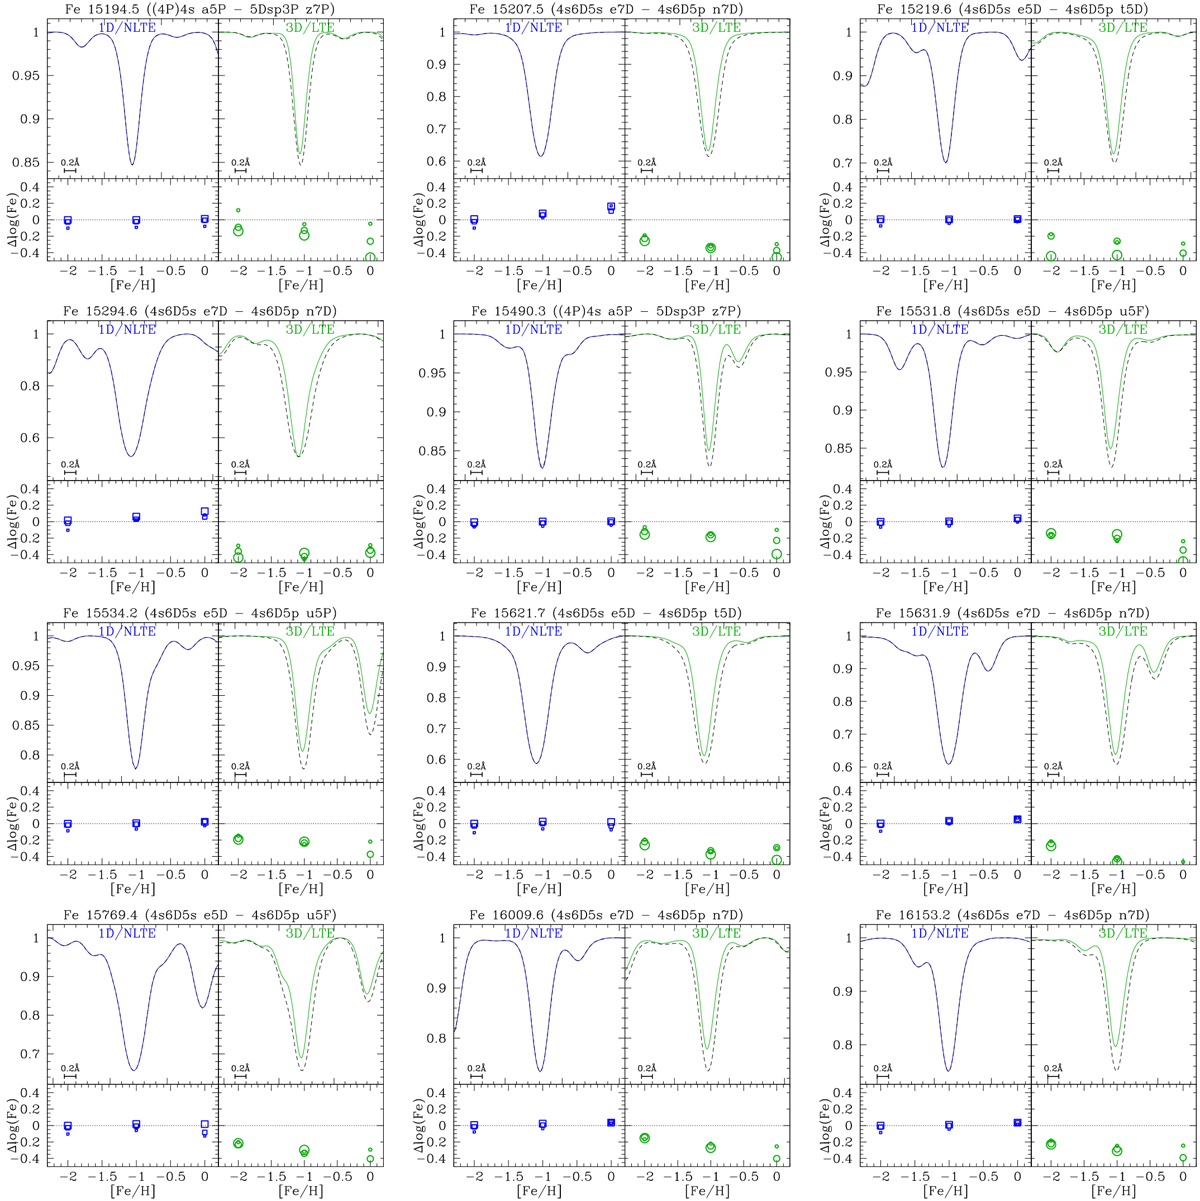
Synthesis of Fe lines used in this work. In each sub-panel the upper part shows the 1D–LTE synthesis (dashed black line), the 3D–LTE synthesis (green), and for some sub-panels the 1D–NLTE synthesis from Kovalev et al. (2018; blue) for a Teff = 4500 K, log g = 2.5, [M/H] = −1.0 model. The lower parts display the corresponding differences in abundances of the same line between the 1D–LTE model and the 3D model for various temperatures and metallicities (large symbols Teff = 4000 K, log g = 1.5; medium-sizesymbols Teff = 4500 K, log g = 2.5; small symbols Teff = 5000 K, log g = 2.5).
Current usage metrics show cumulative count of Article Views (full-text article views including HTML views, PDF and ePub downloads, according to the available data) and Abstracts Views on Vision4Press platform.
Data correspond to usage on the plateform after 2015. The current usage metrics is available 48-96 hours after online publication and is updated daily on week days.
Initial download of the metrics may take a while.