Fig. 1
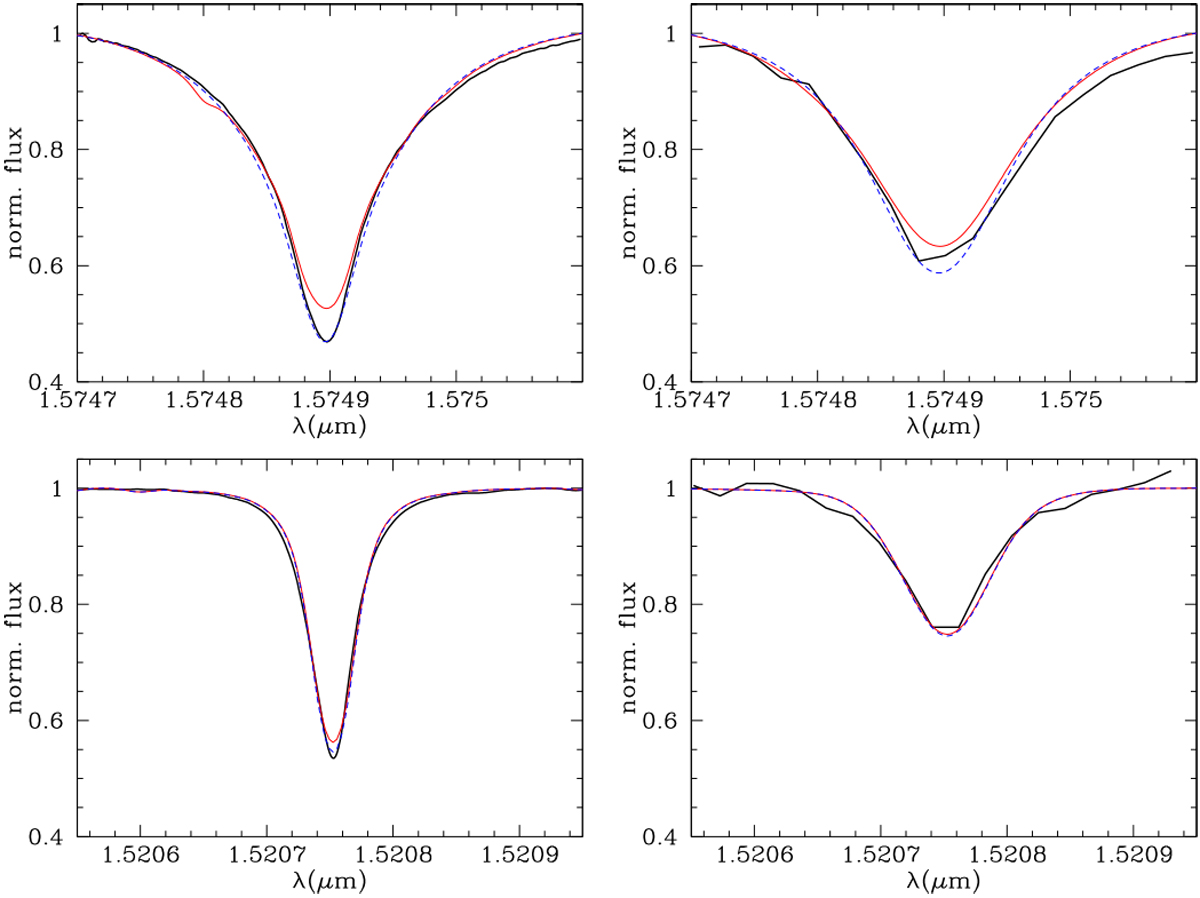
Illustration of an observed Mg line (upper panels) and an Fe line (lower panels) and their respective 1D–LTE (red) and 1D–NLTE (blue) models in the solar spectrum (Livingston & Wallace 1991). Left panels: high-resolution (R > 100 000) andvery high signal-to-noise ratio (S∕N > 800) observations, while right panels: same spectrum at lower resolution (R ≈ 22 000) and lower signal-to-noise ratio (S∕N = 100). Although the high-resolution spectra clearly highlight some modelling issues around the core of the lines, the effect is less clearly visible in the lower resolution spectrum.
Current usage metrics show cumulative count of Article Views (full-text article views including HTML views, PDF and ePub downloads, according to the available data) and Abstracts Views on Vision4Press platform.
Data correspond to usage on the plateform after 2015. The current usage metrics is available 48-96 hours after online publication and is updated daily on week days.
Initial download of the metrics may take a while.