Fig. 10.
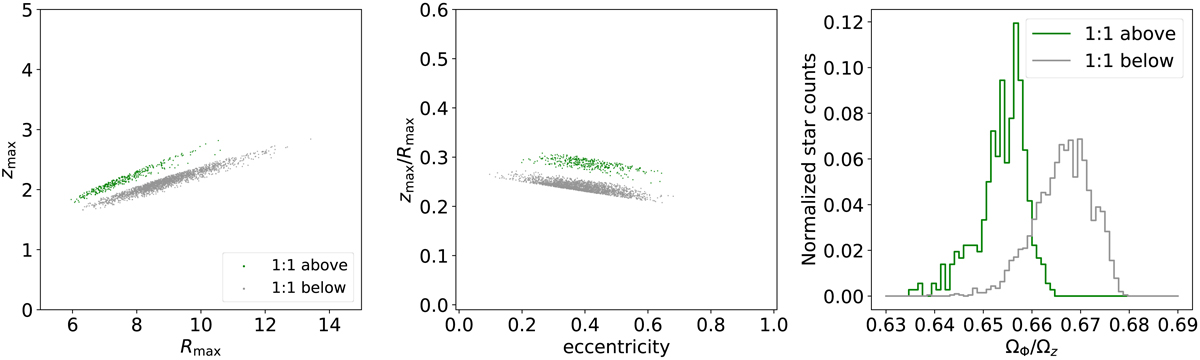
Selection of stars (left panel) around the gap in Rmax vs. zmax for the Ωz : ΩR= 1:1 resonance for stars in the thick-disc sample. Their mapping to eccentricity vs. zmax/Rmax and the distributions of their frequency ratios Ωϕ/Ωz are, respectively, shown in the middle and right panels. The last panel shows that the sample is bifurcated at Ωϕ/Ωz= 2:3.
Current usage metrics show cumulative count of Article Views (full-text article views including HTML views, PDF and ePub downloads, according to the available data) and Abstracts Views on Vision4Press platform.
Data correspond to usage on the plateform after 2015. The current usage metrics is available 48-96 hours after online publication and is updated daily on week days.
Initial download of the metrics may take a while.