Fig. 8
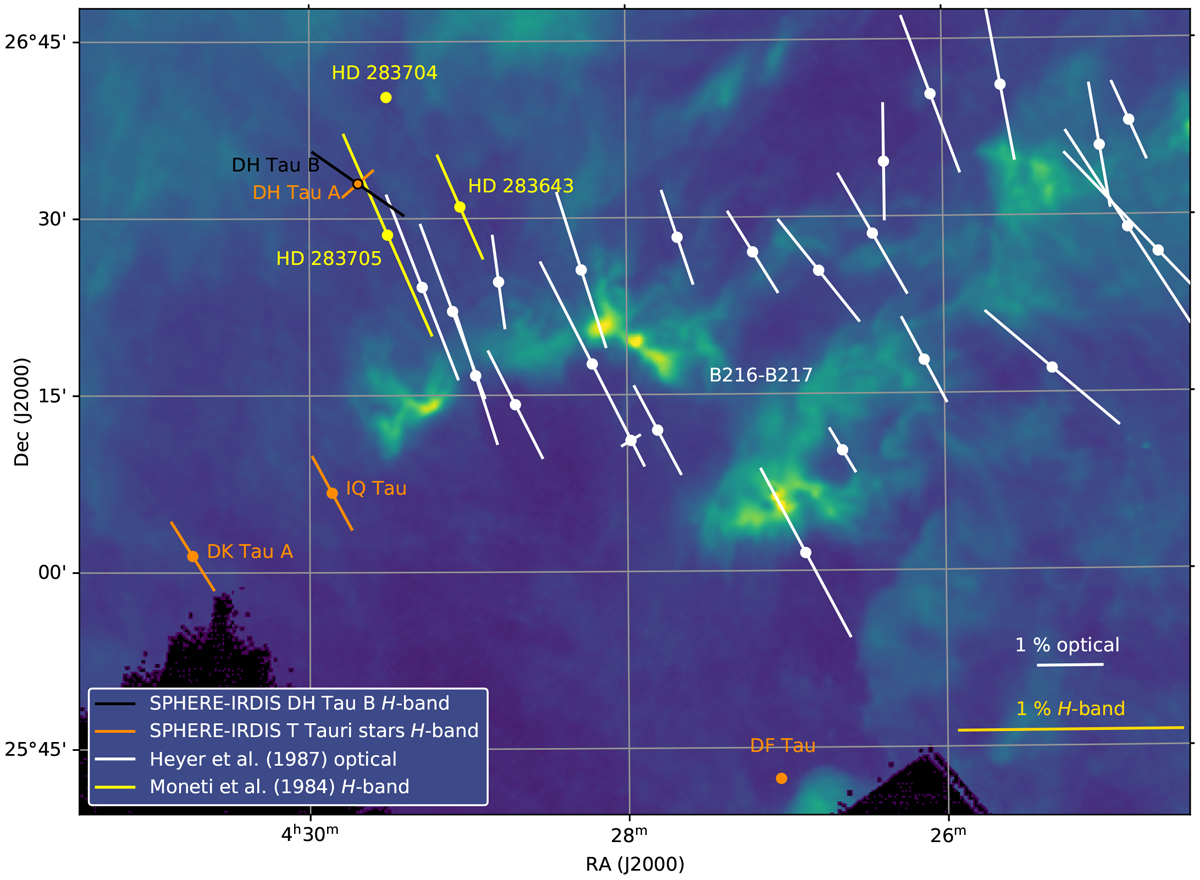
Map of the linear polarization of DH Tau B and nearby stars superimposed on a Herschel-SPIRE map at 350 μm. The length and orientation of the lines indicate the degree and angle of linear polarization, respectively. The black line shows the H-band polarization we measure for DH Tau B, and the orange lines display the SPHERE-IRDIS H-band measurements of DH Tau A and three other nearby T Tauri stars whose archival data we analyzed. White lines show optical measurements by Heyer et al. (1987). Yellow lines indicate the H-band polarization of three bright stars closest to DH Tau as derived from optical measurements by Moneti et al. (1984). The length of the H-band vectors are scaled by a factor of four with respect to the optical vectors.
Current usage metrics show cumulative count of Article Views (full-text article views including HTML views, PDF and ePub downloads, according to the available data) and Abstracts Views on Vision4Press platform.
Data correspond to usage on the plateform after 2015. The current usage metrics is available 48-96 hours after online publication and is updated daily on week days.
Initial download of the metrics may take a while.