Fig. 6
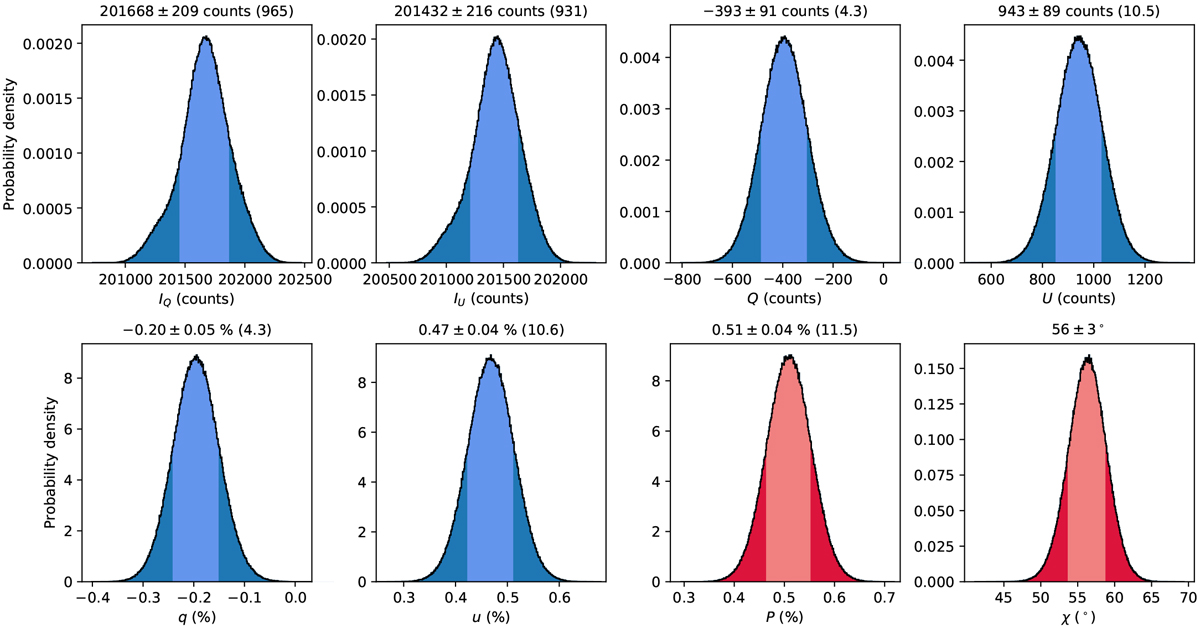
Final probability distributions of the signals of DH Tau B in IQ, IU , Q, and U (top row), and in normalized Stokes q and u, degree of linear polarization, and angle of linear polarization (bottom row) from the 2019-10-24 data set of DH Tau, using an aperture radius of 8 pixels. The median values of the distributions, as well as the uncertainties computed from the two-sided 68.27% equal-tailed interval around the median, are shown above the graphs. The S/N, i.e., the median value divided by the largest uncertainty, is shown within parentheses. The 68.27% intervals are also indicated by the light-blue and light-red shaded areas.
Current usage metrics show cumulative count of Article Views (full-text article views including HTML views, PDF and ePub downloads, according to the available data) and Abstracts Views on Vision4Press platform.
Data correspond to usage on the plateform after 2015. The current usage metrics is available 48-96 hours after online publication and is updated daily on week days.
Initial download of the metrics may take a while.