Fig. 5
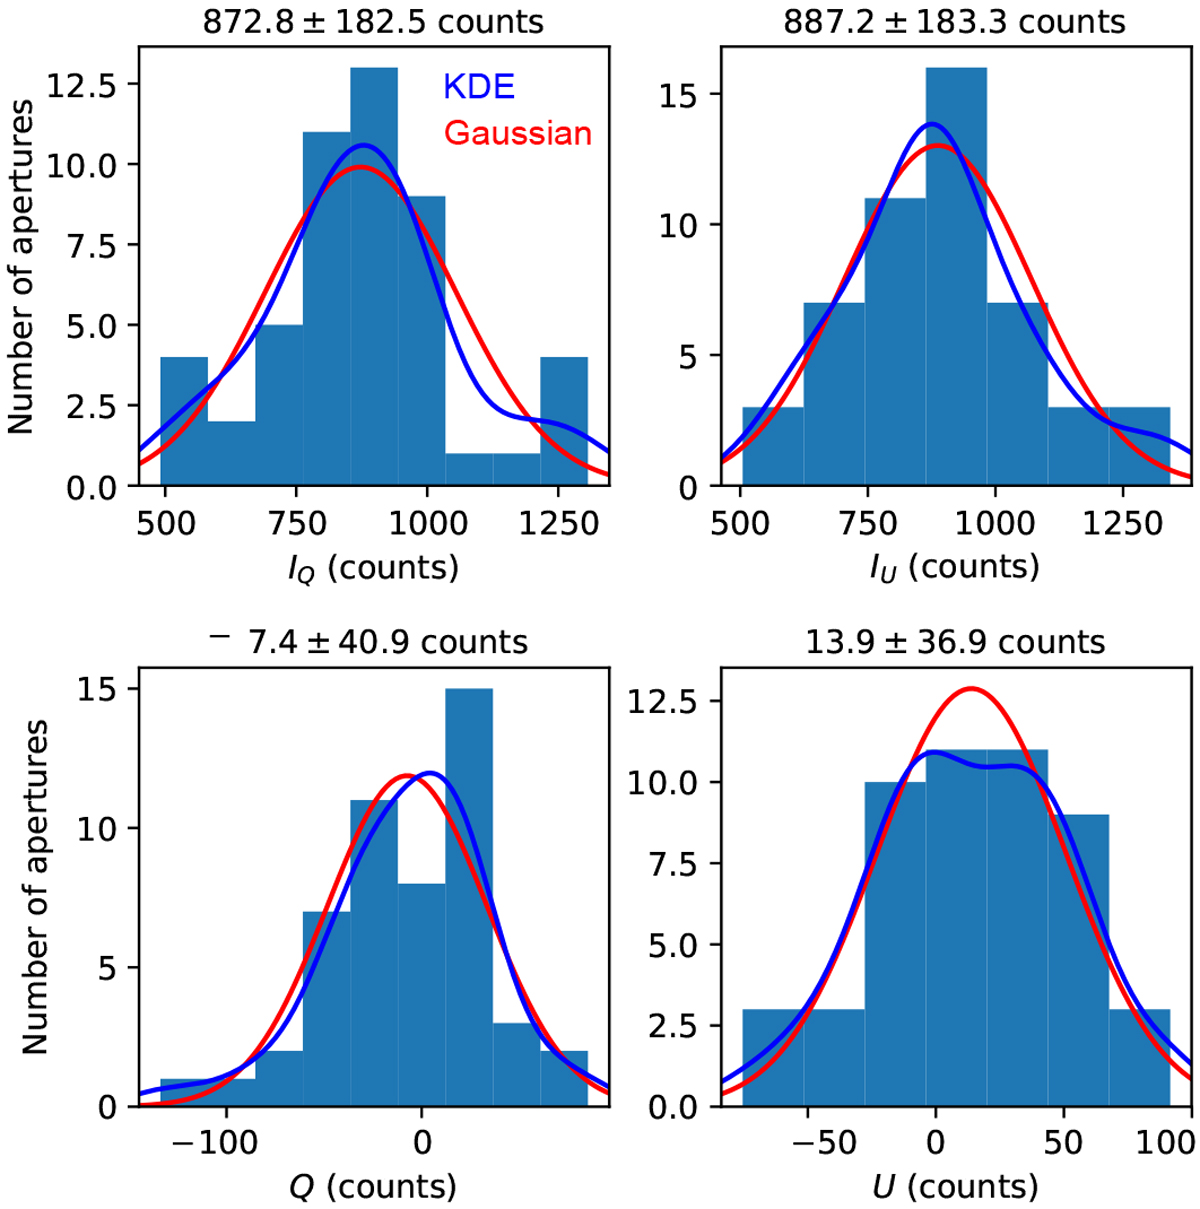
Histograms of the background in IQ, IU , Q, and U of the 2019-10-24 data set of DH Tau, as obtained through summing the flux in the 8-pixel-radius comparison apertures of Fig. 3. The mean and standard deviation of the samples are shown above the histograms. The blue curves show the PDFs as estimated through KDE and the red curves show the best-fit Gaussian distributions for comparison.
Current usage metrics show cumulative count of Article Views (full-text article views including HTML views, PDF and ePub downloads, according to the available data) and Abstracts Views on Vision4Press platform.
Data correspond to usage on the plateform after 2015. The current usage metrics is available 48-96 hours after online publication and is updated daily on week days.
Initial download of the metrics may take a while.