Fig. C.2
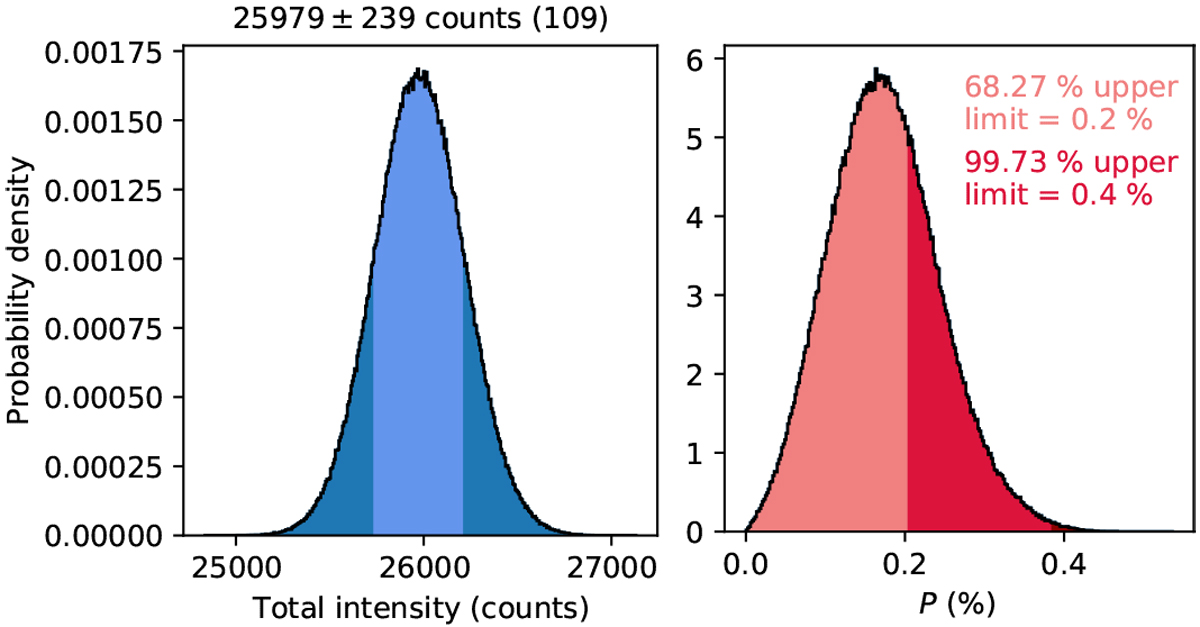
Final probability distributions of the signal of β Pic b from the 2019-11-26 data set of β Pic, using an aperture radius of 1.85 pixels. Left: probability distribution of the total intensity. The mean and 68.27% uncertainties of the distribution are shown above the graph, with the latter also indicated by the light-blue shaded area. The S/N is shown within parentheses. Right: probability distribution of the degree of linear polarization. The upper limits computed from the one-sided 68.27 and 99.73% intervals are indicated by the light-red and darker red shaded areas, respectively.
Current usage metrics show cumulative count of Article Views (full-text article views including HTML views, PDF and ePub downloads, according to the available data) and Abstracts Views on Vision4Press platform.
Data correspond to usage on the plateform after 2015. The current usage metrics is available 48-96 hours after online publication and is updated daily on week days.
Initial download of the metrics may take a while.