Fig. A.1.
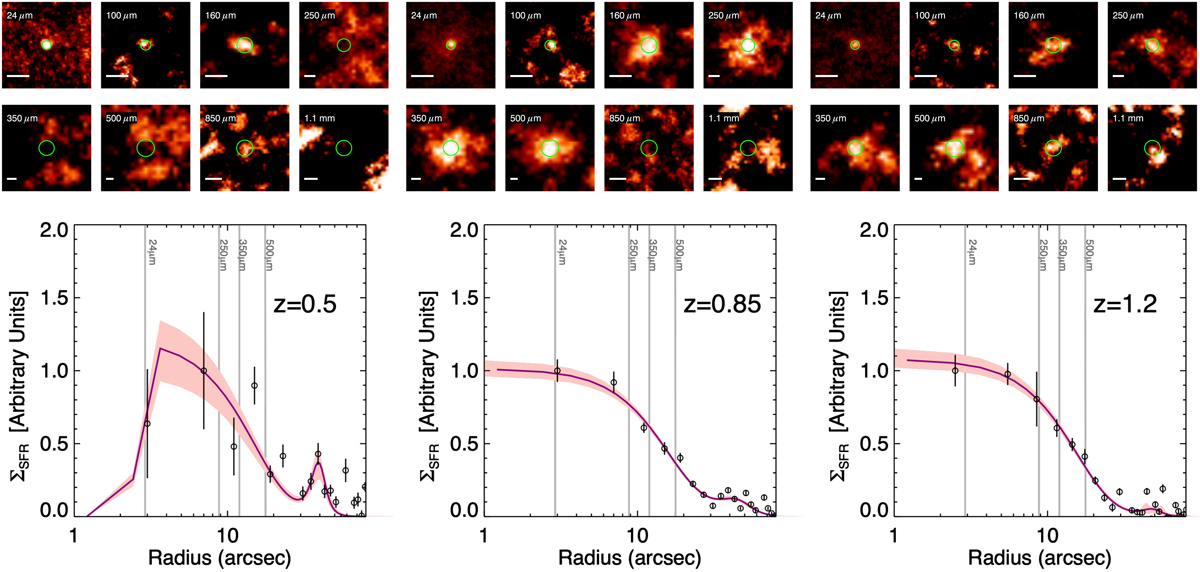
Stacked cutouts and SFR surface density profiles. Top: median stacked cutouts at the position of the QGs in the three redshift bins, at 24 μm (Spitzer/MIPS), 100 and160 μm (Herschel/PACS), 250, 350 and 500 μm Herschel/SPIRE, 850 μm (JCMT/SCUBA-2) and 1.1 mm (ASTE/AzTEC). The white line in each panel has a length of 15”, while the green circles show the beam FWHM in each band. Bottom: Normalised, average SFR surface density (ΣSFR) profile of the satellites of QGs (circles) in various redshift bins. The error bars correspond to the standard deviation of the surface density in each bin. The pink lines and the shaded regions show the best-fit ‘quenched’ β-models to ΣSFR and their uncertainties. The vertical grey lines denote the half-width at half-maximum of the MIPS and SPIRE beams.
Current usage metrics show cumulative count of Article Views (full-text article views including HTML views, PDF and ePub downloads, according to the available data) and Abstracts Views on Vision4Press platform.
Data correspond to usage on the plateform after 2015. The current usage metrics is available 48-96 hours after online publication and is updated daily on week days.
Initial download of the metrics may take a while.