Fig. 7.
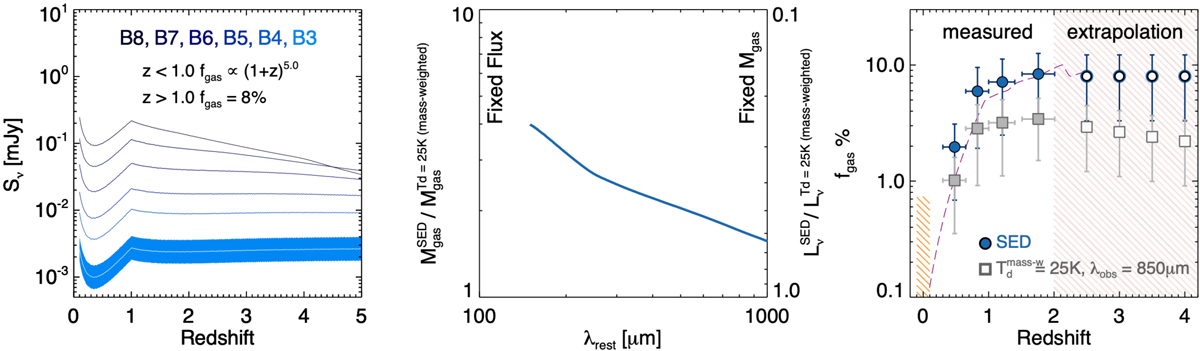
ALMA outlook and systematics. Left: ALMA flux densities in various bands for an evolving fgas as (1 + z)5.0 at 0.0 < z < 1.0 and fixed fgas = 8%, at z > 1.0. The predicted fluxes are derived using the average DL07 SED presented in Fig. 6(right) and are corrected for CMB effects. The blue shaded region depicts the range of predicted flux densities in ALMA Band 3 assuming a 50% uncertainty in the adopted fgas. Middle: ratio of Mgas estimates, as inferred for a fixed monochromatic luminosity at a given rest-frame wavelength from (1) scaling the average SED of QGs presented in Fig. 6(right), ![]() , and (2) the prescription of Scoville et al. (2017),
, and (2) the prescription of Scoville et al. (2017), ![]() . Similarly, the right y-axis depicts the ratio of the monochromatic luminosities predicted by the two methods for a fixed Mgas. Right: the effect of the adopted Mgas-method on the recovered evolution of fgas. Filled blue circles correspond to the values presented in Fig. 4 using the full SED analysis (
. Similarly, the right y-axis depicts the ratio of the monochromatic luminosities predicted by the two methods for a fixed Mgas. Right: the effect of the adopted Mgas-method on the recovered evolution of fgas. Filled blue circles correspond to the values presented in Fig. 4 using the full SED analysis (![]() ). Filled grey squares correspond to the values derived from the Scoville et al. (2017) prescription, assuming monochromatic observations at λobs = 850 μm, (
). Filled grey squares correspond to the values derived from the Scoville et al. (2017) prescription, assuming monochromatic observations at λobs = 850 μm, (![]() ). The empty points (and the colour-shaded region) are an extrapolation to higher redshifts under the assumption of fixed
). The empty points (and the colour-shaded region) are an extrapolation to higher redshifts under the assumption of fixed ![]() = 8% at z > 2.0.
= 8% at z > 2.0.
Current usage metrics show cumulative count of Article Views (full-text article views including HTML views, PDF and ePub downloads, according to the available data) and Abstracts Views on Vision4Press platform.
Data correspond to usage on the plateform after 2015. The current usage metrics is available 48-96 hours after online publication and is updated daily on week days.
Initial download of the metrics may take a while.