Fig. 6.
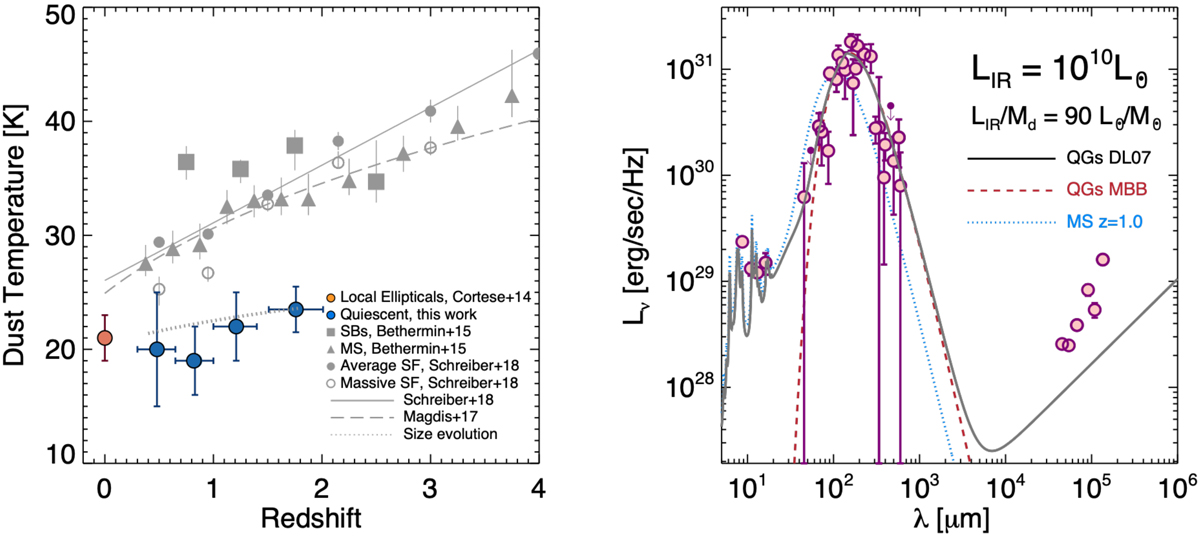
Dust temperatures and average SED. Left: the evolution of Td in QGs. The filled blue circles mark the luminosity-weighted Td for the stacked QGs at 0.3 < z < 2.0, including the results from G18. Filled grey triangles and squares indicate SFGs on the MS and strong starbursts from Béthermin et al. (2015). Filled and open grey circles represent the mass-averaged values and the most massive galaxies (11.0 < log(M*/M⊙) < 11.5, Salpeter IMF) for the star-forming sample of Schreiber et al. (2018a), respectively. The solid and dashed grey lines indicate the best fit models from Schreiber et al. (2018a) and Béthermin et al. (2015), extending the parameterisation of Magdis et al. (2012). The dotted grey line indicates the expected Td track for a size evolution of QGs, R ∝ (1 + z)−1.48. The track is normalised to the Td of the z = 1.8 sample. Right: composite and template FIR SED for z > 0 QGs. The magenta circles (arrows) correspond to the photometry (3σ upper limits) of the stacked ensembles presented in Fig. 3 normalised to LIR = 1010 L⊙ (and Mdust = 1.11 × 10⁸ M⊙). The DL07 and MBB model fits to the SED are shown with grey and red dashed lines. The dotted blue line correspond to the typical SED of z = 1.0 MS galaxies from Magdis et al. (2012), normalised to the same LIR. The QG template is publicly available at www.georgiosmagdis.com/software/.
Current usage metrics show cumulative count of Article Views (full-text article views including HTML views, PDF and ePub downloads, according to the available data) and Abstracts Views on Vision4Press platform.
Data correspond to usage on the plateform after 2015. The current usage metrics is available 48-96 hours after online publication and is updated daily on week days.
Initial download of the metrics may take a while.