Fig. 5.
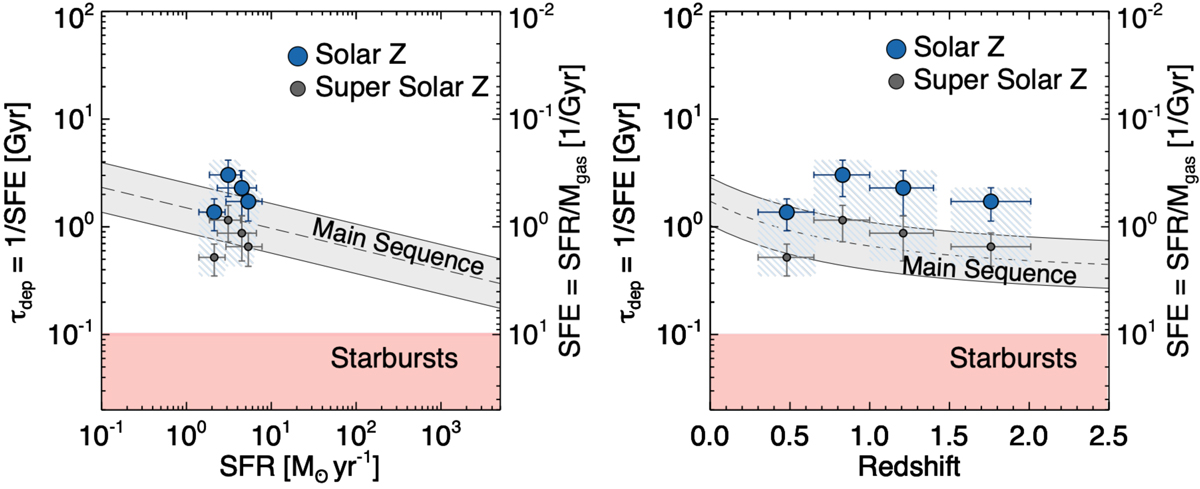
Gas depletion timescales. Left: gas depletion time scale (tdep) as a function of SFR. The blue (grey) circles correspond to the stacked samples of QGs for the case of solar (super solar) metallicity, assuming GDR = 92 (35). The dashed grey line and the grey shaded region depict the trend for MS galaxies from Sargent et al. (2014) with a scatter of 0.23 dex. The magenta shaded region marks the area with τdep < 100 Myr, typical of star-bursting galaxies. Right: gas depletion time scale as a function of redshift. The symbols are the same as in the left panel. The dashed grey line and the grey shaded region depict the trend of Liu et al. (2019) for MS galaxies at fixed M* = 2 × 10¹¹ M⊙ and its corresponding scatter of 0.23 dex.
Current usage metrics show cumulative count of Article Views (full-text article views including HTML views, PDF and ePub downloads, according to the available data) and Abstracts Views on Vision4Press platform.
Data correspond to usage on the plateform after 2015. The current usage metrics is available 48-96 hours after online publication and is updated daily on week days.
Initial download of the metrics may take a while.