Fig. 4.
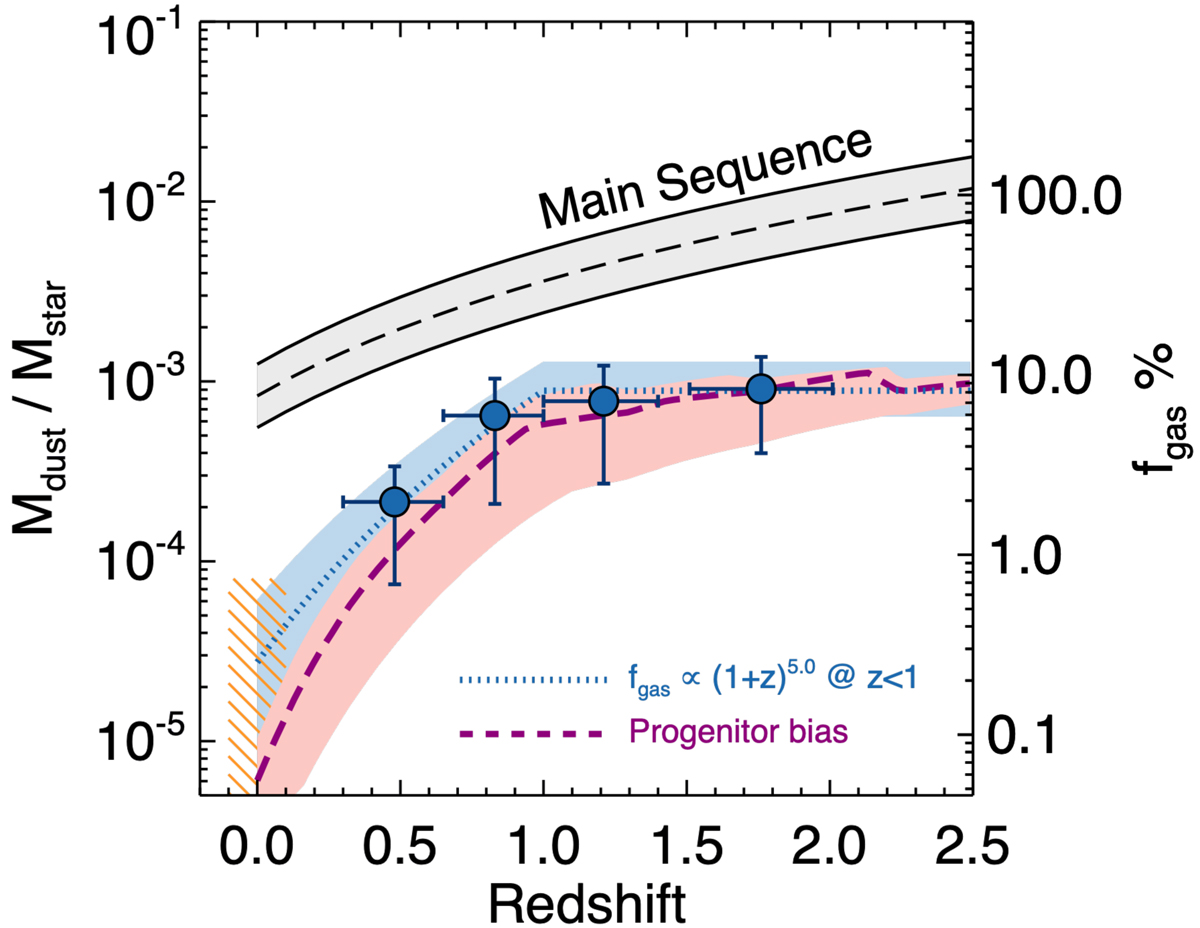
Evolution of the dust to stellar mass ratio and of the gas fraction of QGs. The filled blue circles mark the Mdust/M* of the stacked QGs in the 0.3 < z < 2.0 range, including the results from G18. The grey shaded region depicts the trend for MS galaxies from Kokorev et al. (2021). The orange shaded region captures the range of Mdust/M* for local QGs, as drawn from the literature (see text). The dotted blue line (blue shaded region) corresponds to the best fit (scatter) to the 0.0 < z < 1.0 Mdust/M* data of QGs, with a functional form of Mdust/M* ∝ (1 + z)5.0. The bold, dashed purple line (shaded region) depicts the evolution (scatter) of Mdust/M* (and of fgas) as derived from the progenitor bias analysis of Gobat et al. (2020), which is discussed in Sects. 5.2 and 6. The conversion of Mdust/M* to fgas assumes solar metallicity and GDR = 92.
Current usage metrics show cumulative count of Article Views (full-text article views including HTML views, PDF and ePub downloads, according to the available data) and Abstracts Views on Vision4Press platform.
Data correspond to usage on the plateform after 2015. The current usage metrics is available 48-96 hours after online publication and is updated daily on week days.
Initial download of the metrics may take a while.