Fig. 3.
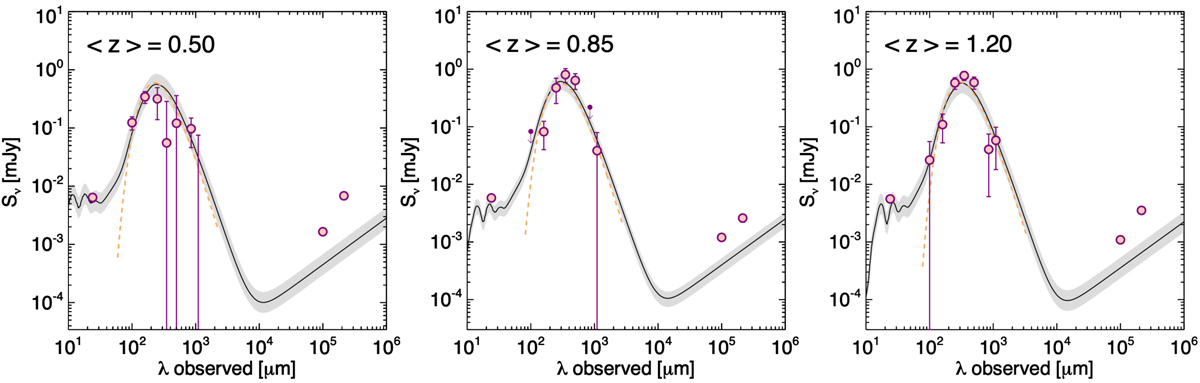
Observed median IR SEDs of massive QGs. The magenta circles mark the observed photometry, with arrows indicating 3σ upper limits for bands where the measured flux density was negative. We note that the radio points at 10 and 20 cm were not included in the modelling. The black line and the grey shaded areas indicate the best-fit model from the Draine & Li (2007) templates and the associated uncertainty. The dashed orange line is the best fit adopting a single Td modified black body. The left, middle, and right panels show the results for the redshift intervals 0.3 < z < 0.65, 0.65 < z < 1.0, and 1.0 < z < 1.4, respectively. Salient properties of the sample are reported in Table 1.
Current usage metrics show cumulative count of Article Views (full-text article views including HTML views, PDF and ePub downloads, according to the available data) and Abstracts Views on Vision4Press platform.
Data correspond to usage on the plateform after 2015. The current usage metrics is available 48-96 hours after online publication and is updated daily on week days.
Initial download of the metrics may take a while.