Fig. 2.
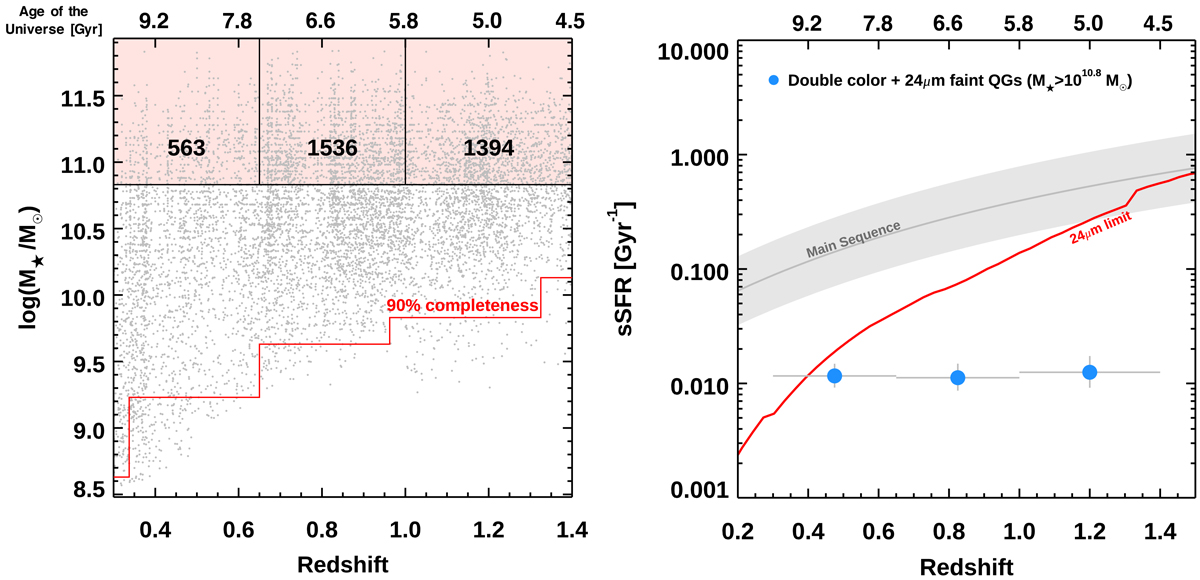
Selection and binning. Left: grey points showing the final sample of double-colour selected and 24 μm faint QGs in the redshift vs. stellar mass plane. The rose area and the black grid mark the limits of the bins used to group galaxies for stacking. The number of stacked sources per bin are displayed. The red line indicates the 90% stellar mass completeness limit for QGs in the ‘deep’ UltraVISTA sample (Laigle et al. 2016), adjusted for the different IMF. Right: blue points showing the position of the stacked massive QGs (M* > 1010.8 M⊙) in the redshift vs. sSFR(UV) plane. The error bars on the redshift indicate the width of the bins. Only the statistical uncertainties on sSFR(UV) are shown on the y-axis. The solid red line indicates the 3σ detection limit for Spitzer/MIPS at 24 μm (σ = 15 μJy, Jin et al. 2018) converted to SFR using the MS templates from Magdis et al. (2012) and assuming M* = 1011.2 M⊙, matching the median stellar mass of our sample in each redshift bin. The grey shaded area and the grey line indicate the location of the MS and its 0.3 dex scatter, computed for a galaxy with M* = 1011.2 M⊙.
Current usage metrics show cumulative count of Article Views (full-text article views including HTML views, PDF and ePub downloads, according to the available data) and Abstracts Views on Vision4Press platform.
Data correspond to usage on the plateform after 2015. The current usage metrics is available 48-96 hours after online publication and is updated daily on week days.
Initial download of the metrics may take a while.