Fig. D.1.
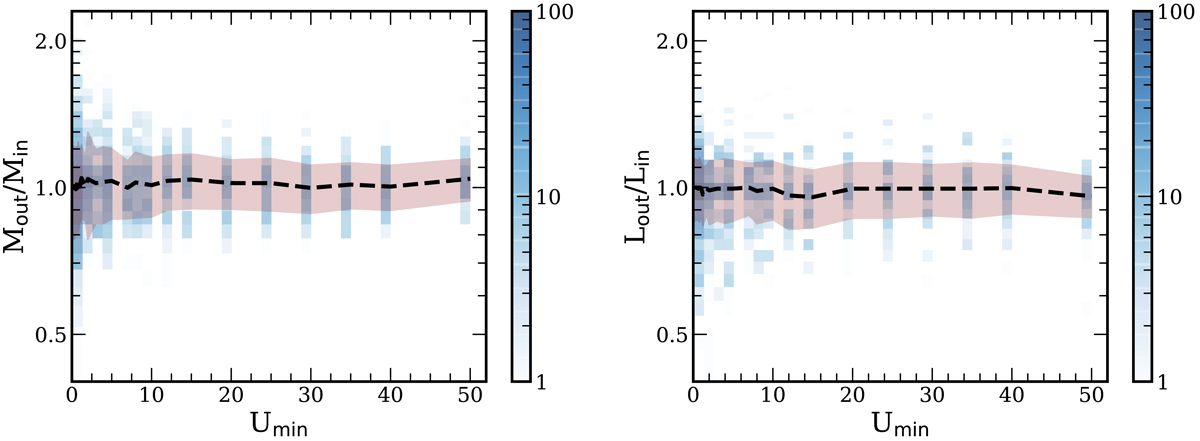
Simulations on the derivation of Mdust and LIR. The ratio of derived over input Mdust (left) and LIR (right) as a function of intrinsic ⟨Umin⟩ for a range of simulated DL07 models mimicking the dynamical range and S/N of the available photometry for our stacked SEDs. For each Umin template the data are colour coded by the density of the points. The pink shaded region encloses the 68% of the derived ratios. Noticeably, the range of the output/input ratios, and thus the corresponding uncertainties are larger for colder templates (Umin < 5.0).
Current usage metrics show cumulative count of Article Views (full-text article views including HTML views, PDF and ePub downloads, according to the available data) and Abstracts Views on Vision4Press platform.
Data correspond to usage on the plateform after 2015. The current usage metrics is available 48-96 hours after online publication and is updated daily on week days.
Initial download of the metrics may take a while.