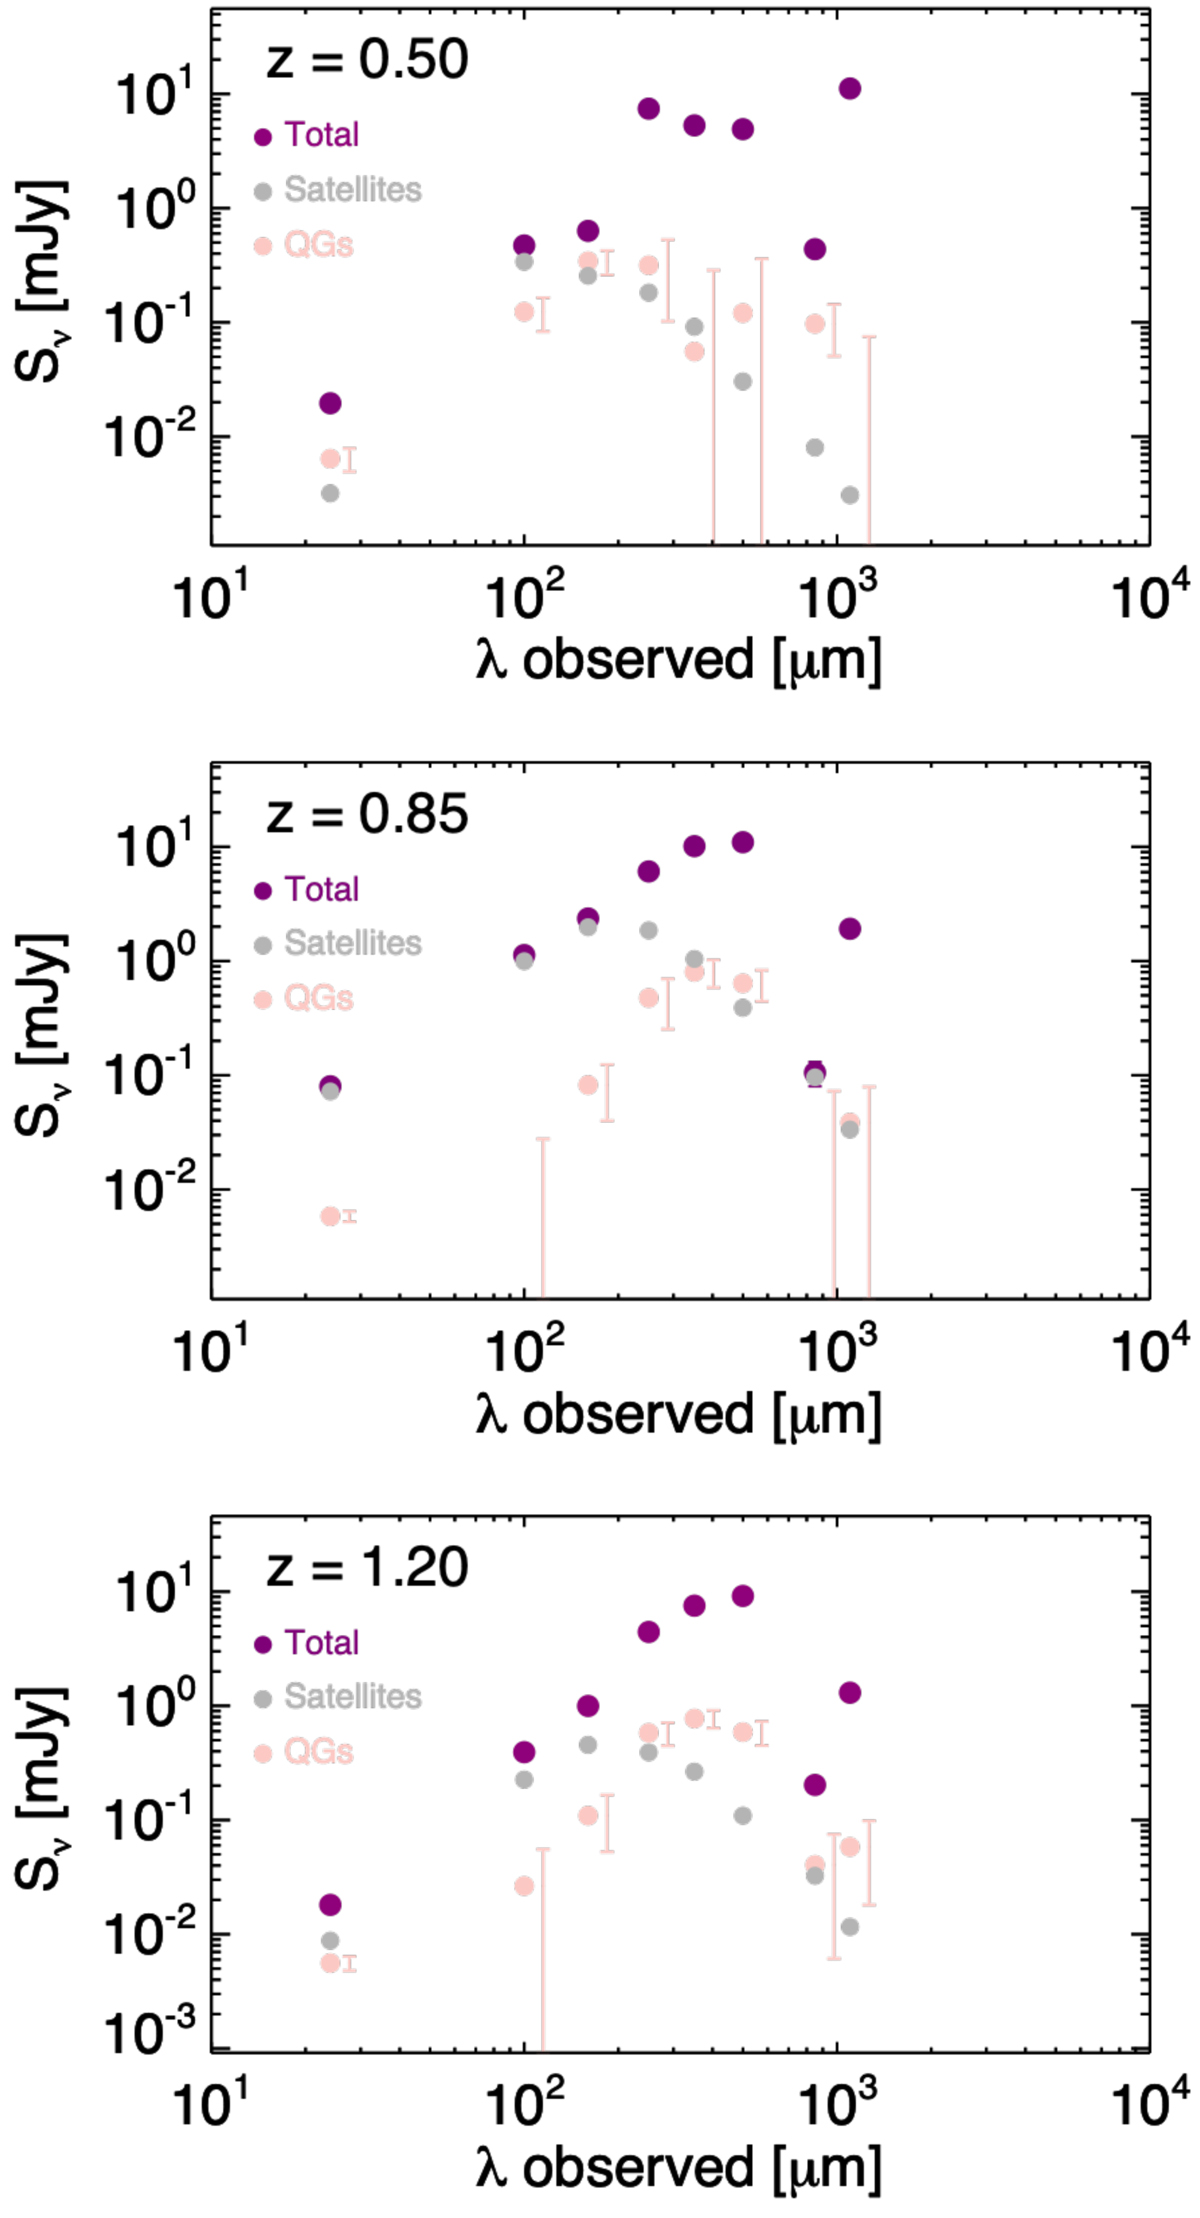
Fig. A.3.

Background-subtracted and bias-corrected FIR SEDs, before and after decomposition in SF and QG components: total signal (purple), SF satellites (grey), and QG with error bars on the side (light pink). Only the point-source component of the QG SED is shown (that is, after subtraction of the autocorrelation term). As described in Sect. 3, the satellite points are fitted to the data at ≤160 μm and extrapolated from Magdis et al. (2012) templates at longer wavelengths.
Current usage metrics show cumulative count of Article Views (full-text article views including HTML views, PDF and ePub downloads, according to the available data) and Abstracts Views on Vision4Press platform.
Data correspond to usage on the plateform after 2015. The current usage metrics is available 48-96 hours after online publication and is updated daily on week days.
Initial download of the metrics may take a while.


