Fig. 1.
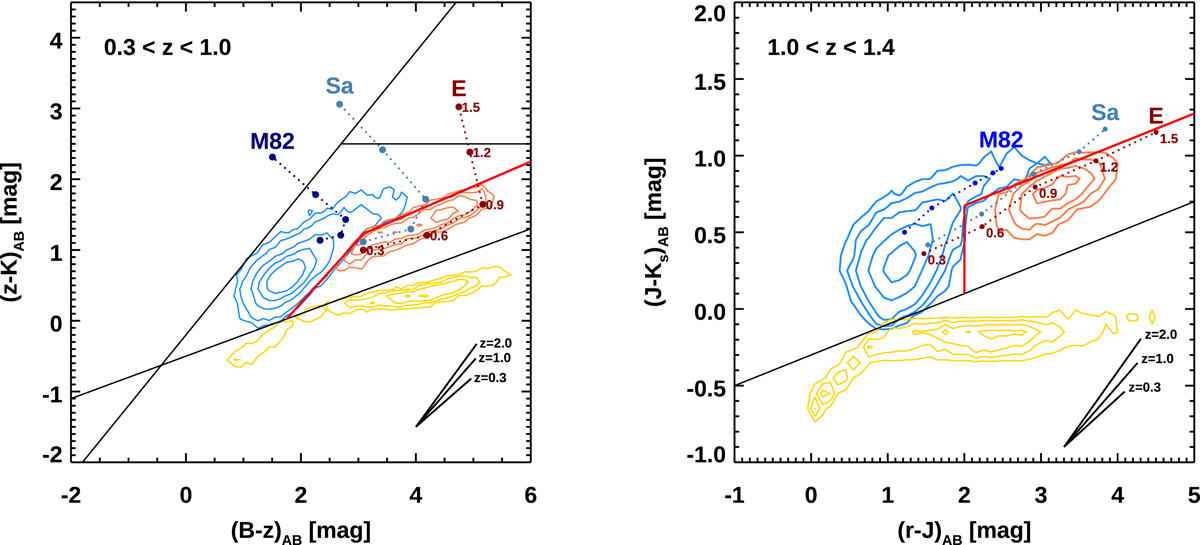
Redshift ranges for an efficient use of the BzK and rJK colour diagrams. Left:BzK diagram for the selection of 0.3 ≤ z < 1.0 QGs. The yellow, blue, and red contours represent the loci of stars, SFGs, and QGs at 0.3 ≤ z < 1.0 selected by the NUVrJ + BzK selection. Sources with a 3σ detection at 24 μm in Jin et al. (2018) have been excluded. The black lines represent the original cuts by Daddi et al. (2004) to select galaxies at 1.4 ≲ z ≲ 2.5. The red lines show our cut at low redshifts (Eq. (1)). For reference, the tracks show the synthetic colours for the 13 Gyr elliptical (E), early-type spirals (Sa), and M82-like templates by Polletta et al. (2007), as marked in the labels. The colours are computed for 0.3 < z < 1.5 in step of Δz = 0.3. No evolutionary effects are included. The black segments show the reddening vectors at z = 0.3, 1, and 2. Right:rJK diagram for the selection of 1.0 ≤ z < 1.4 QGs. The yellow, blue, and red contours represent the loci of stars, SFGs, and QGs at 1.0 ≤ z < 1.4 selected by the NUVrJ + rJK selection. The remaining lines are coded as in the left panel.
Current usage metrics show cumulative count of Article Views (full-text article views including HTML views, PDF and ePub downloads, according to the available data) and Abstracts Views on Vision4Press platform.
Data correspond to usage on the plateform after 2015. The current usage metrics is available 48-96 hours after online publication and is updated daily on week days.
Initial download of the metrics may take a while.