Fig. 6.
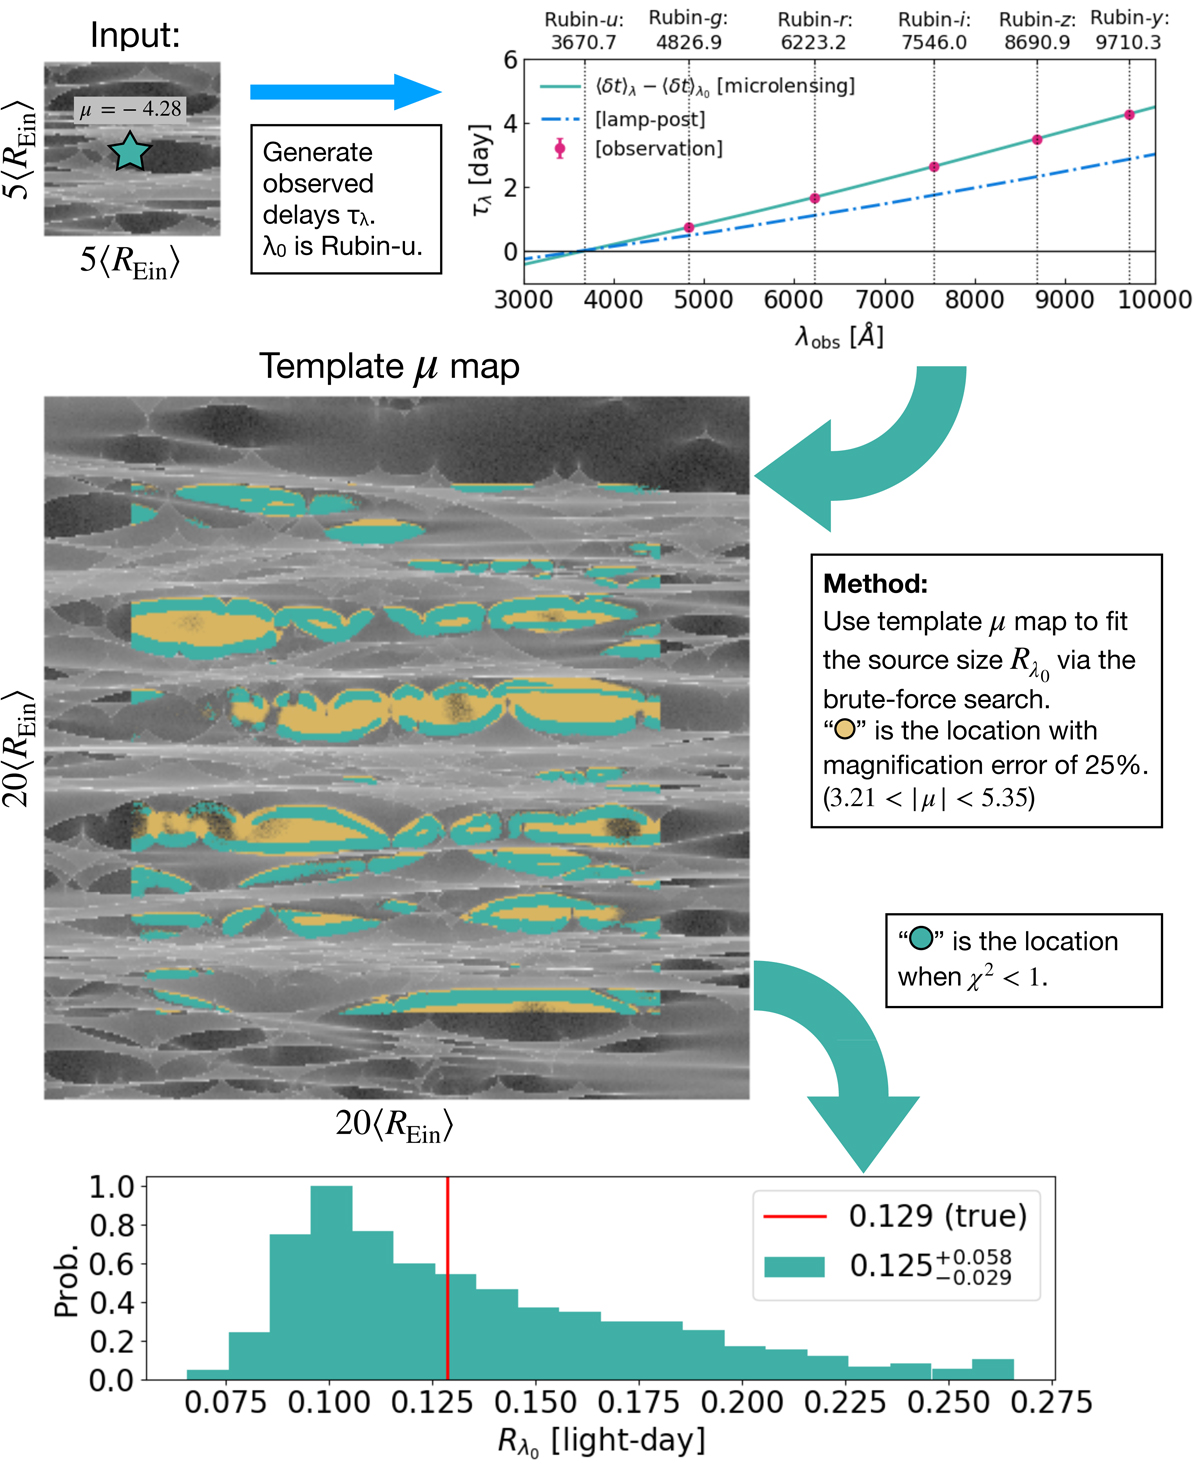
Flow chart of our procedure to simulate multi-band microlensing curves and how to analyze them. The top row shows how we simulated our “observed data” given a fiducial source, the magnification pattern, and microlensing magnification, μ = −4.28. The negative magnification indicates that the image is at the saddle point. The “template magnification map” used to analyze the data is shown in the middle panel (see text), where preselected locations used in fitting the source size are shown in yellow. These correspond to areas where the microlensing magnification matches the fiducial one with ≤25% error. In the end, we only kept the regions where fitting the source size gives χ2 < 1. These are shown in green and were used to produce the distribution of measured source size Rλ0 in the bottom row. For reference purposes, we provide the true (fiducial) size as a red vertical line.
Current usage metrics show cumulative count of Article Views (full-text article views including HTML views, PDF and ePub downloads, according to the available data) and Abstracts Views on Vision4Press platform.
Data correspond to usage on the plateform after 2015. The current usage metrics is available 48-96 hours after online publication and is updated daily on week days.
Initial download of the metrics may take a while.